Dashboards
PULSE dashboards provide a central location to access data-driven visuals, such as graphs and charts, that allow you to monitor and analyze various details on your animals and the status of your dairy. There are three types of dashboards available: Dairy DashboardsDairy Dashboards, Company DashboardsCompany Dashboards, and Overview PagesOverview Pages. You can find this feature under the Dairy menuDairy menu.
Each dashboard contains data sections called "widgets," each of which is built from a third-party application or common DairyComp 305, FeedWatch (on-premise), and ParlorWatch/Parlor reports. You can view PULSE-specific reports that provide data for the dashboard at the bottom of each widget:
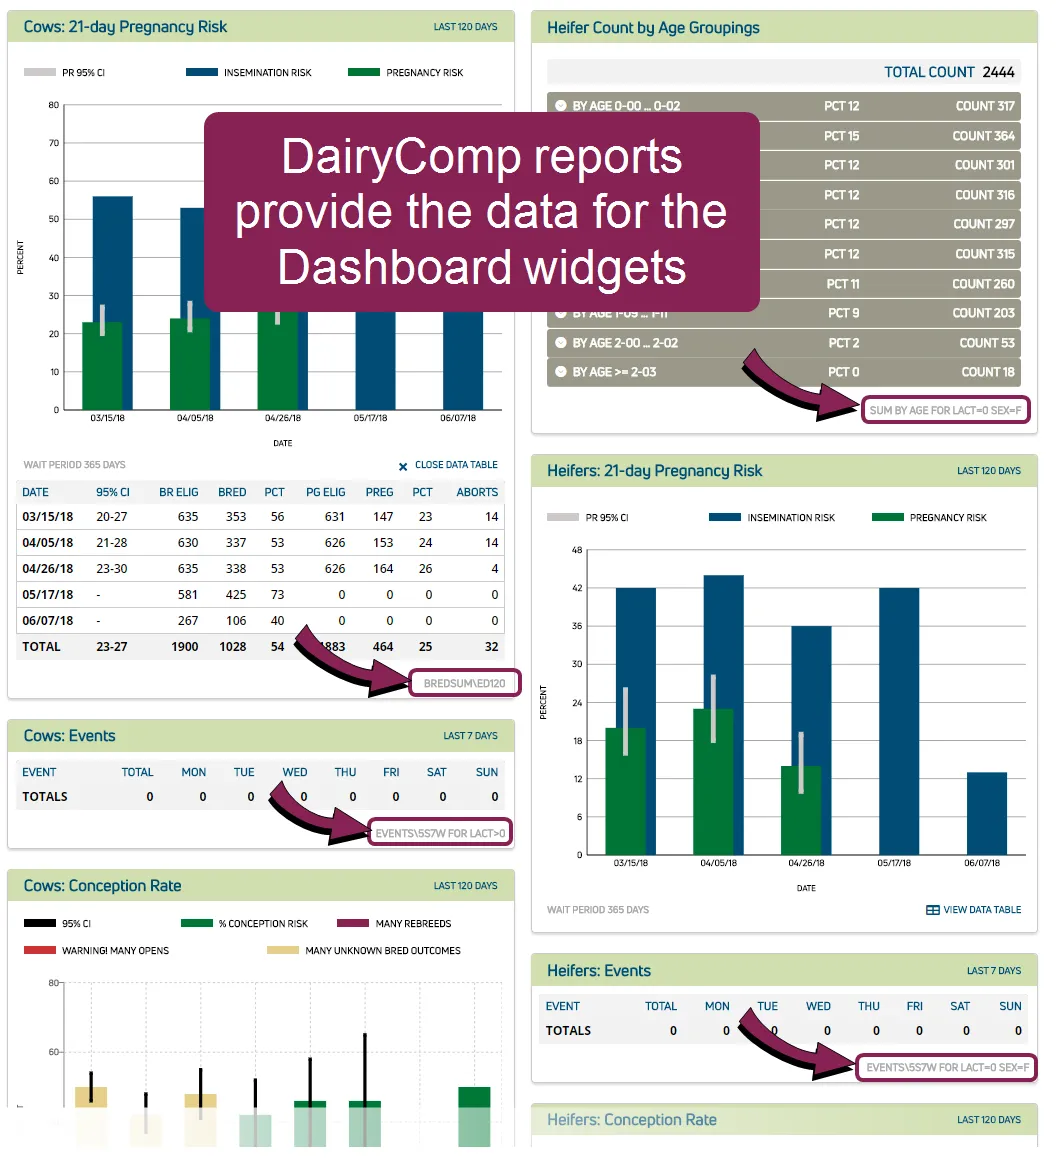
Be sure to scroll down the dashboard to see all widgets, and click the available links to view more data for each of the graphs.
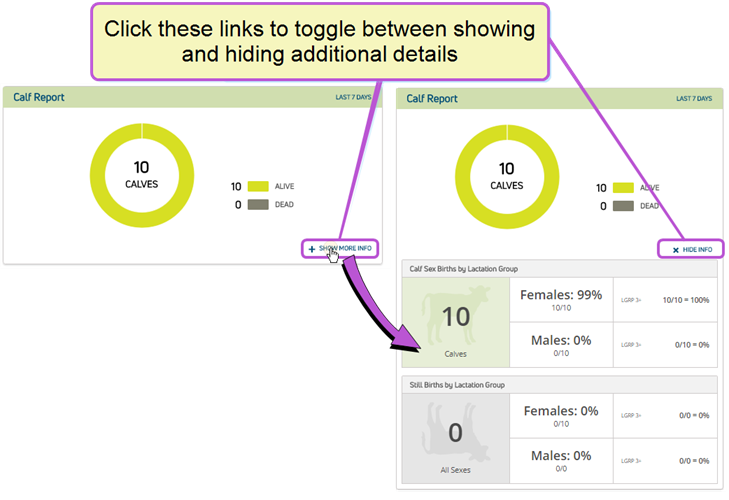
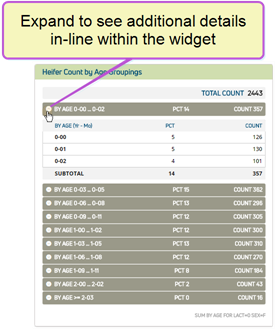
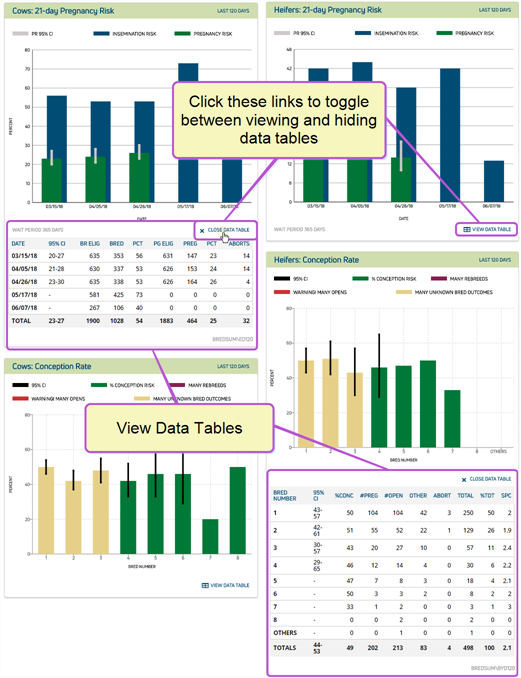
Each dashboard provides different information to help you better manage your dairy. Learn more about each dashboard type:
Dairy Dashboards provide easy‑to‑read graphs and illustrations of essential dairy information. The point‑in‑time, heads-up display helps you see where your dairy stands today, what has happened in the recent past, and where it might be in the next few months. These dashboards are only available when you are viewing a dairy in PULSE; for information on company-level dashboards, see Company DashboardsCompany Dashboards.
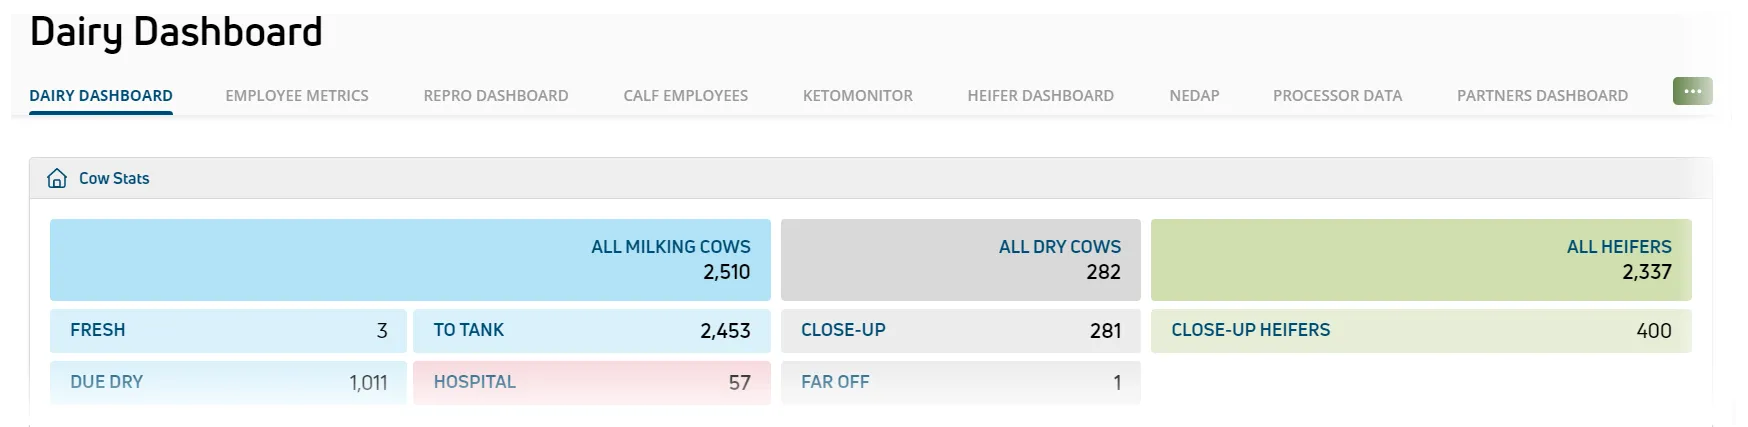
Continue to Widget DescriptionsWidget Descriptions for more information on available widgets.
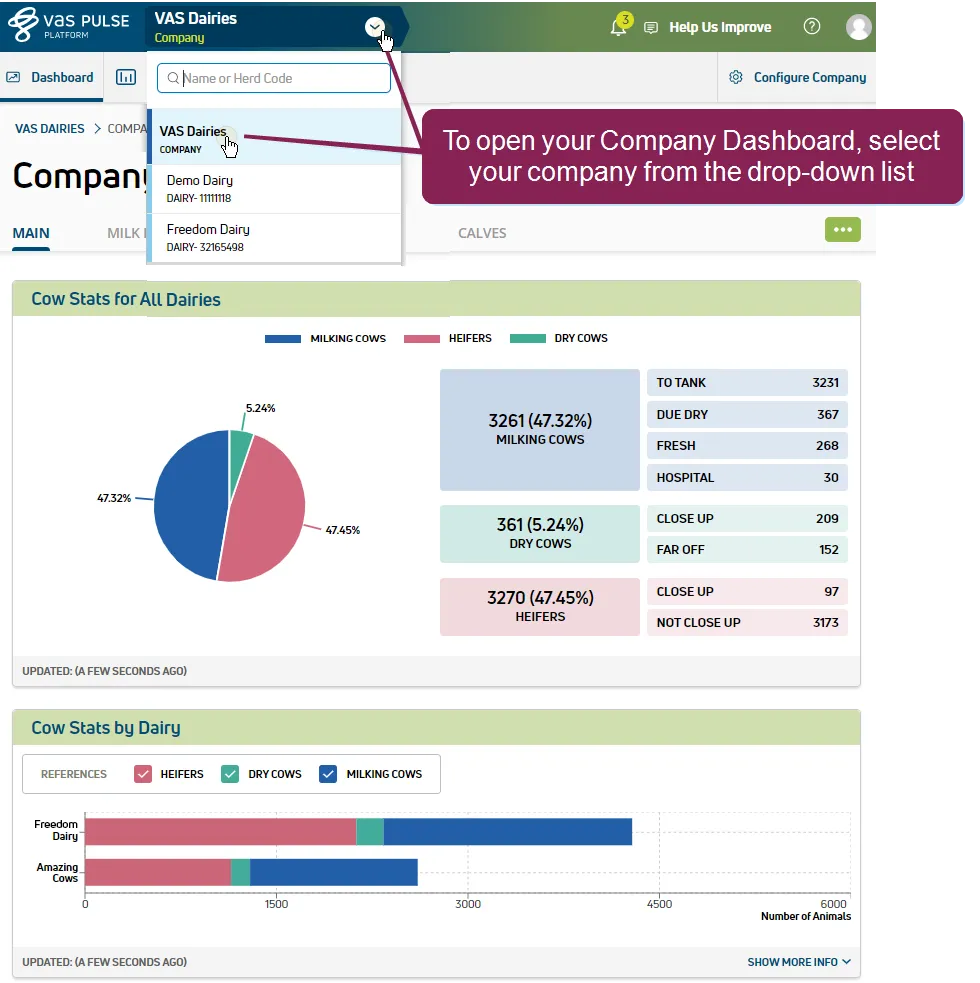
Company Dashboards provide a snapshot view of essential information for all dairies within your company. As illustrated below, key animal data, such as Cow Stats, are available for all company dairies, or can be viewed in a graphical format by individual dairy.
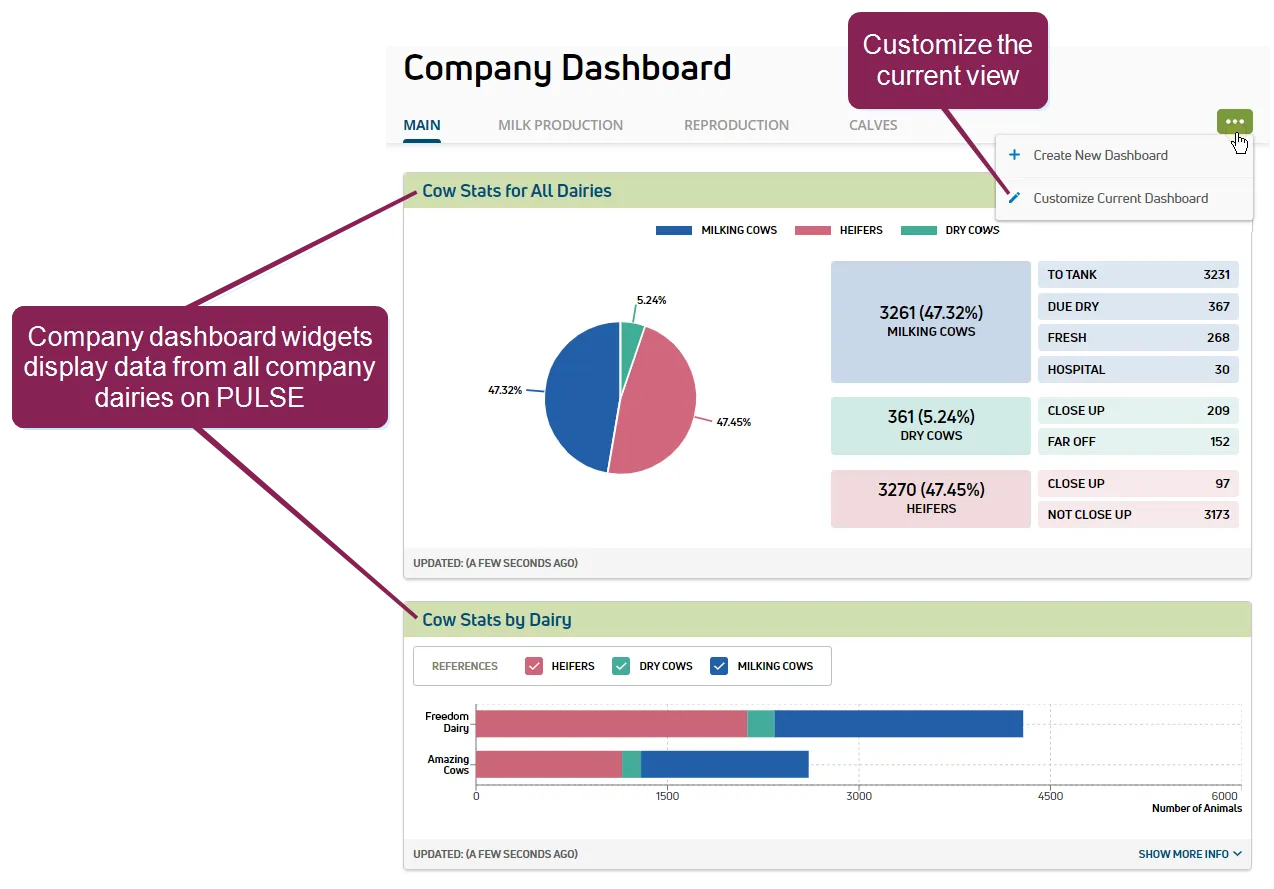
To learn more about Company Dashboards and the different types of widgets you can utilize, see Company DashboardsCompany Dashboards.
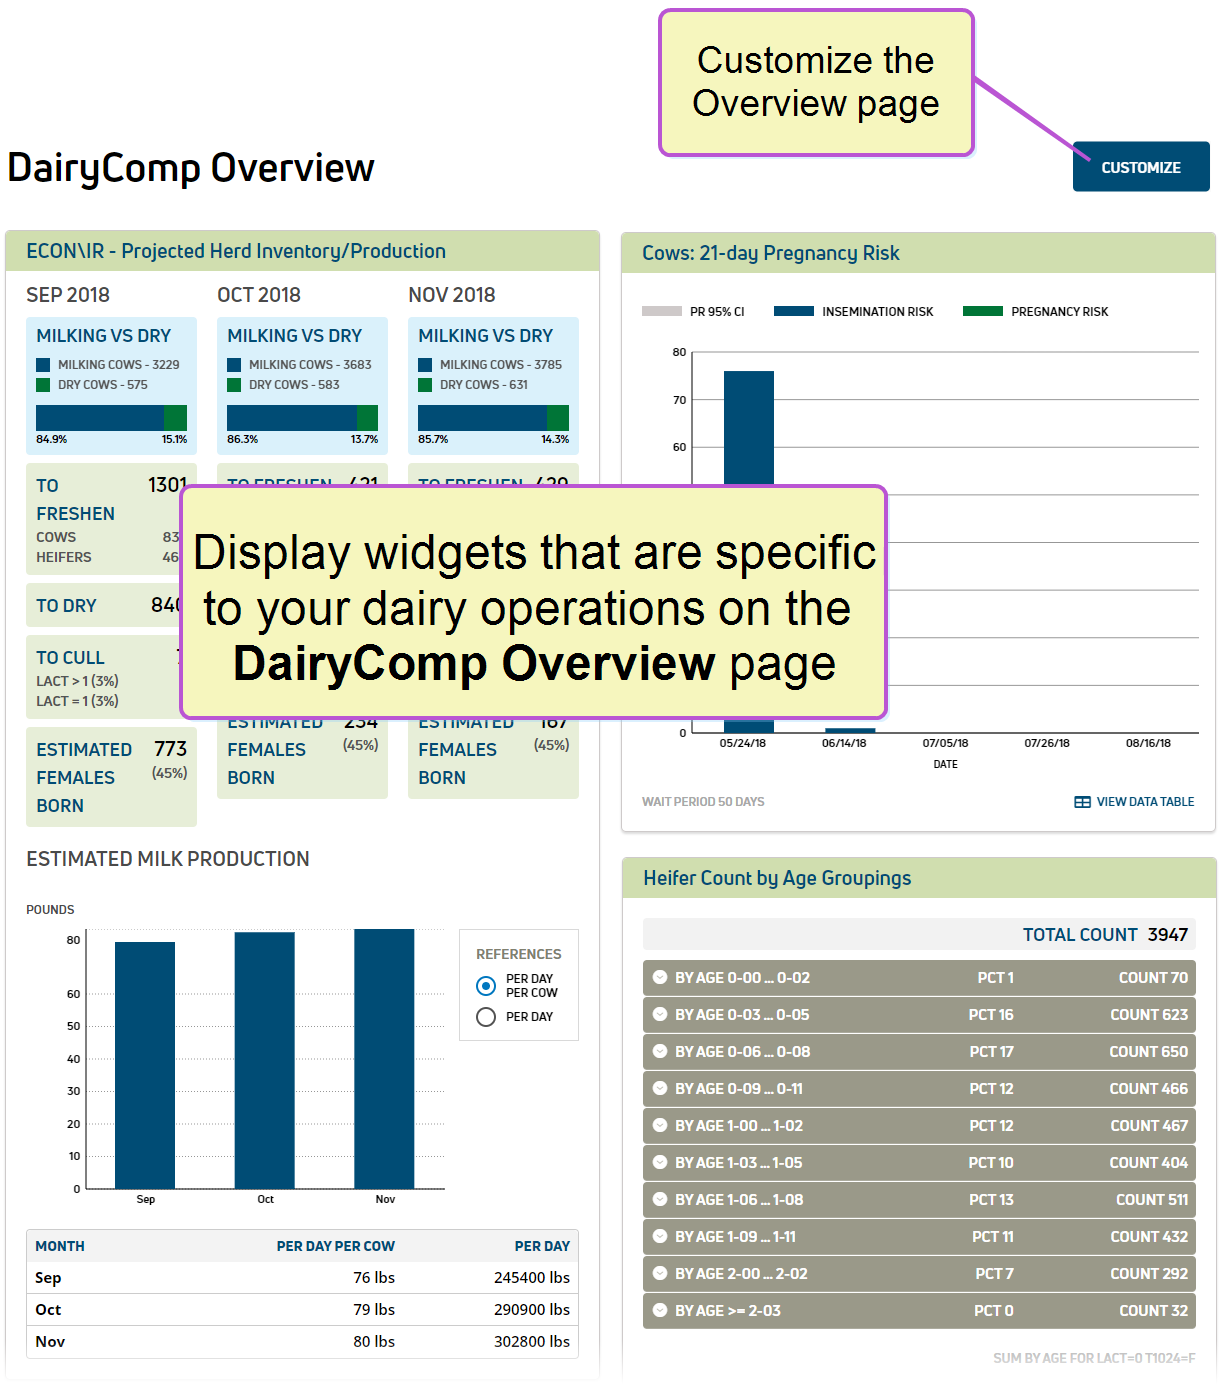

TIP: Are you looking for HerdSights Dashboard? See HerdSightsHerdSights to learn about building custom KPI views and dashboards for your dairy!