Sold & Died
2 min
Use the Sold & Died tab to view data on a weekly, bi-weekly, or monthly basis for the three distinct groupings below.
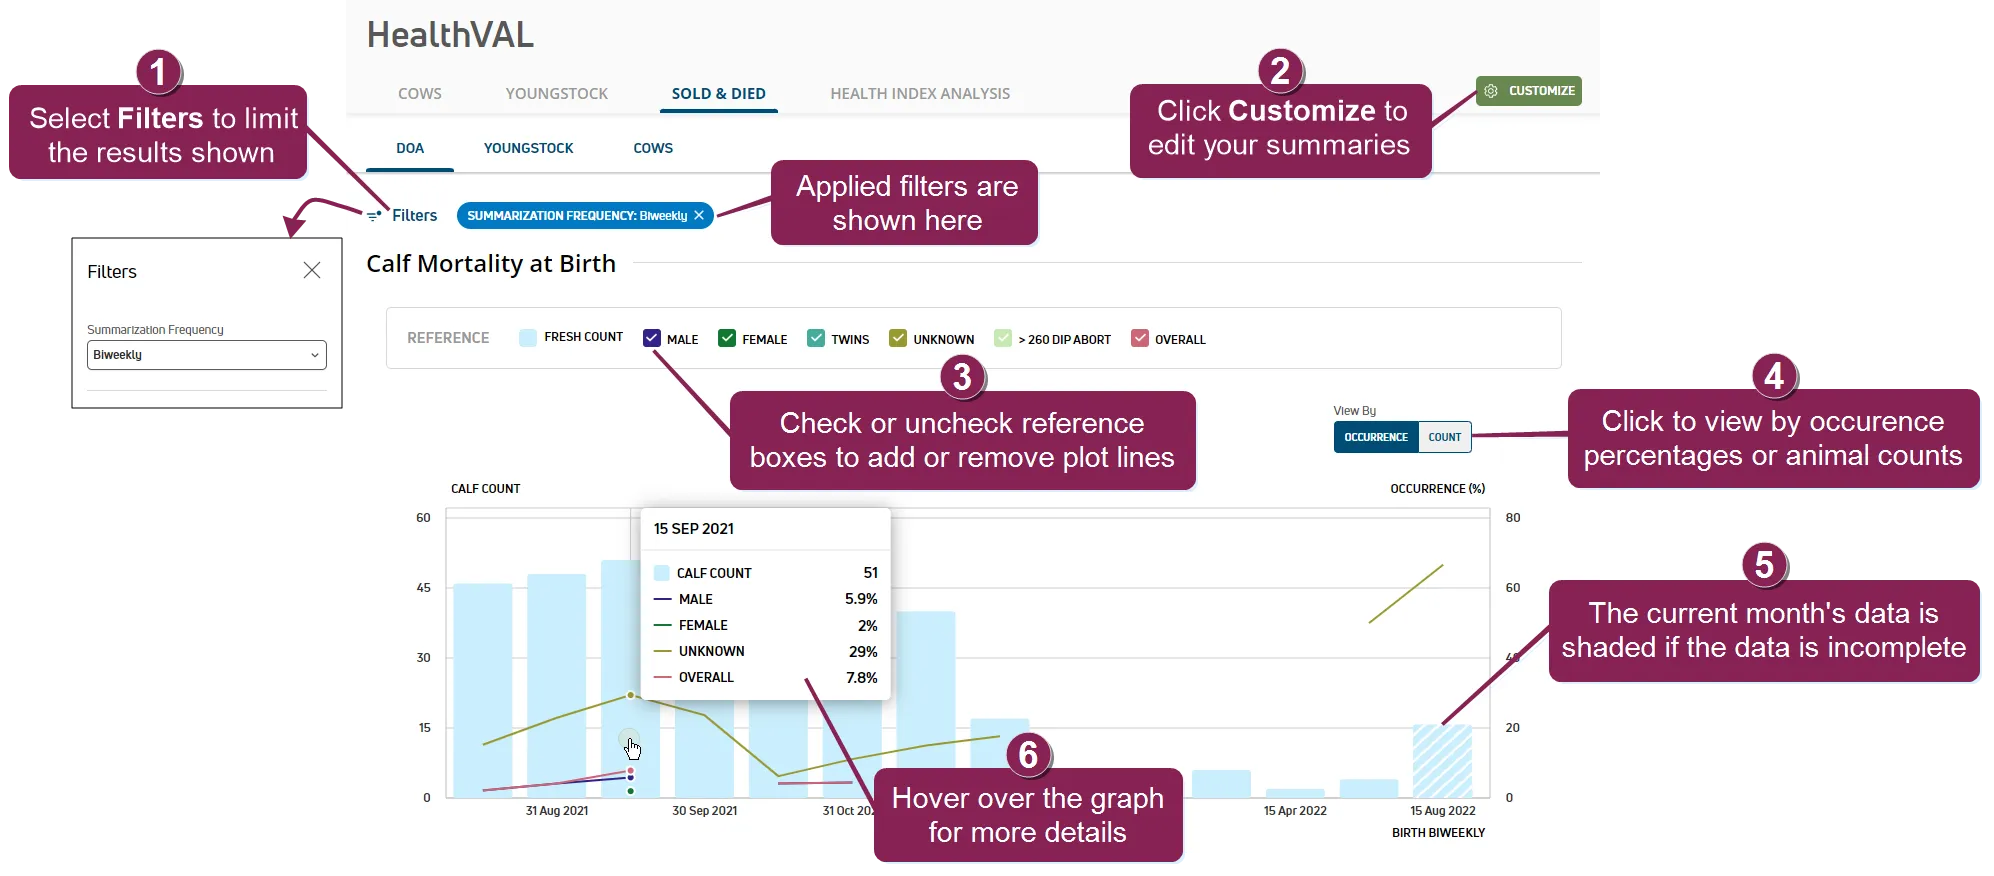
- DOA: Calf death at birth by calf category (Male, Female, Twins, Unknown, >260 DIP Abort, Overall).
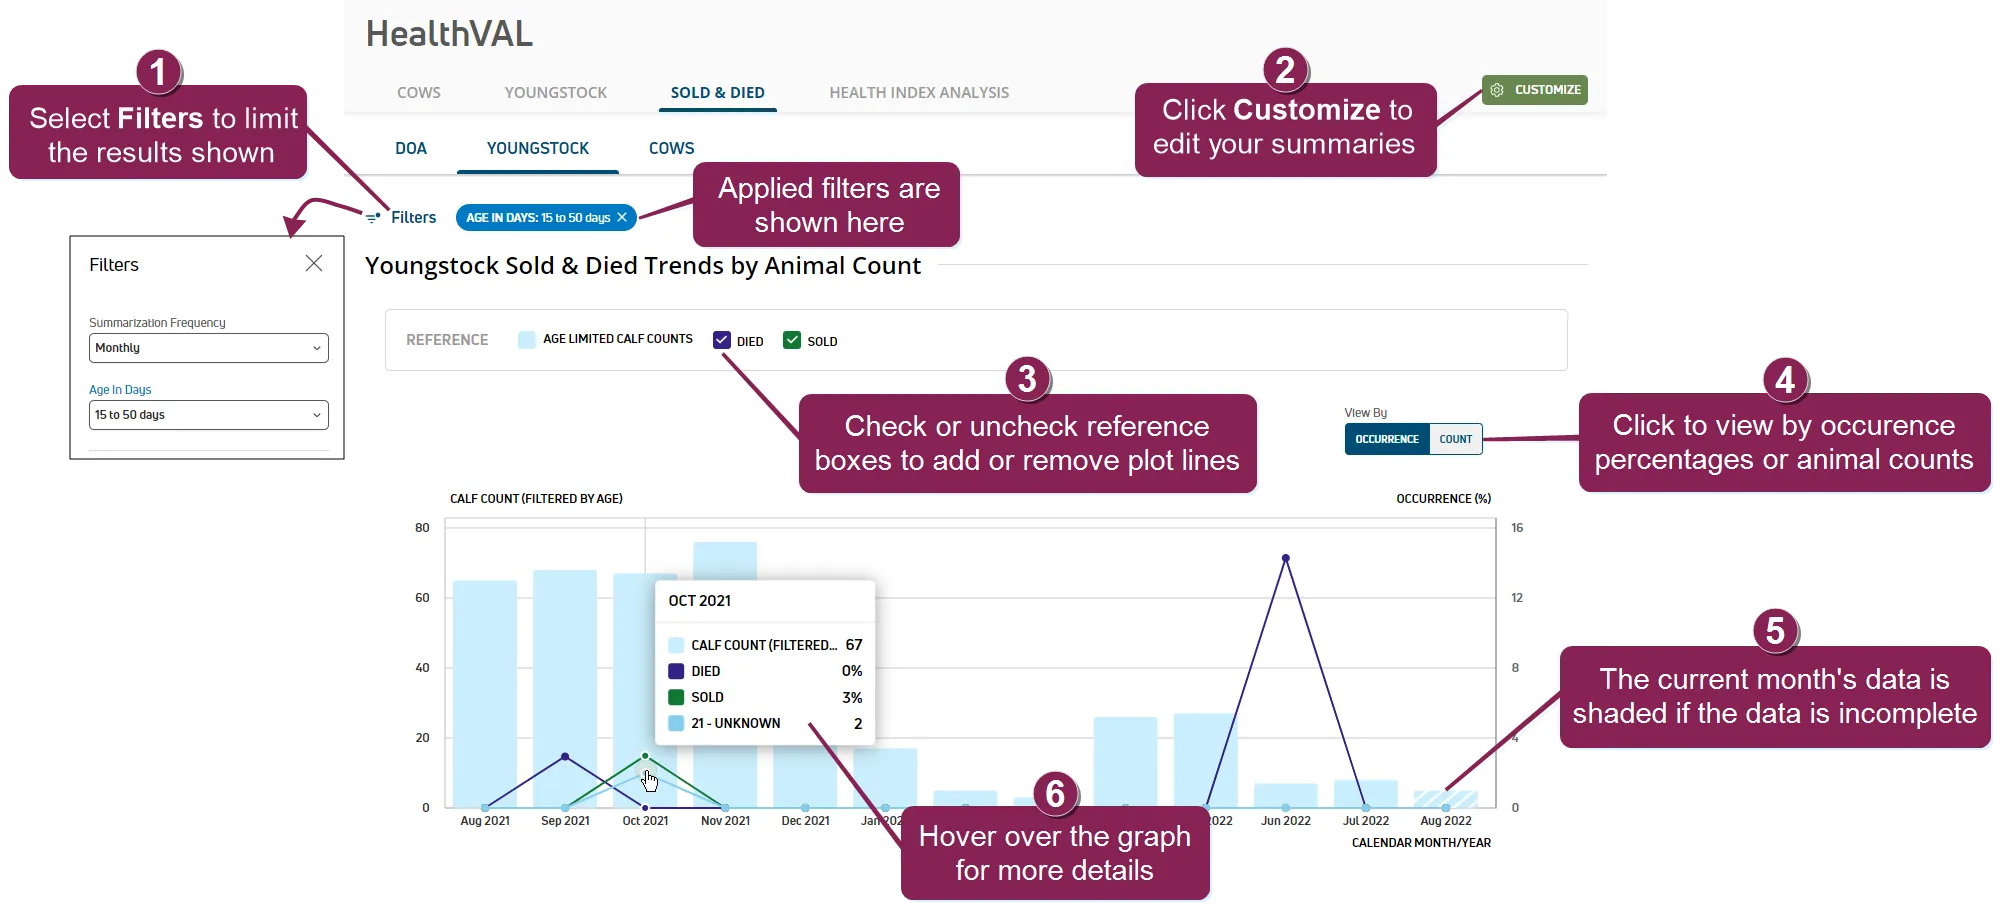
- Youngstock: Youngstock sold and died by age (in days).
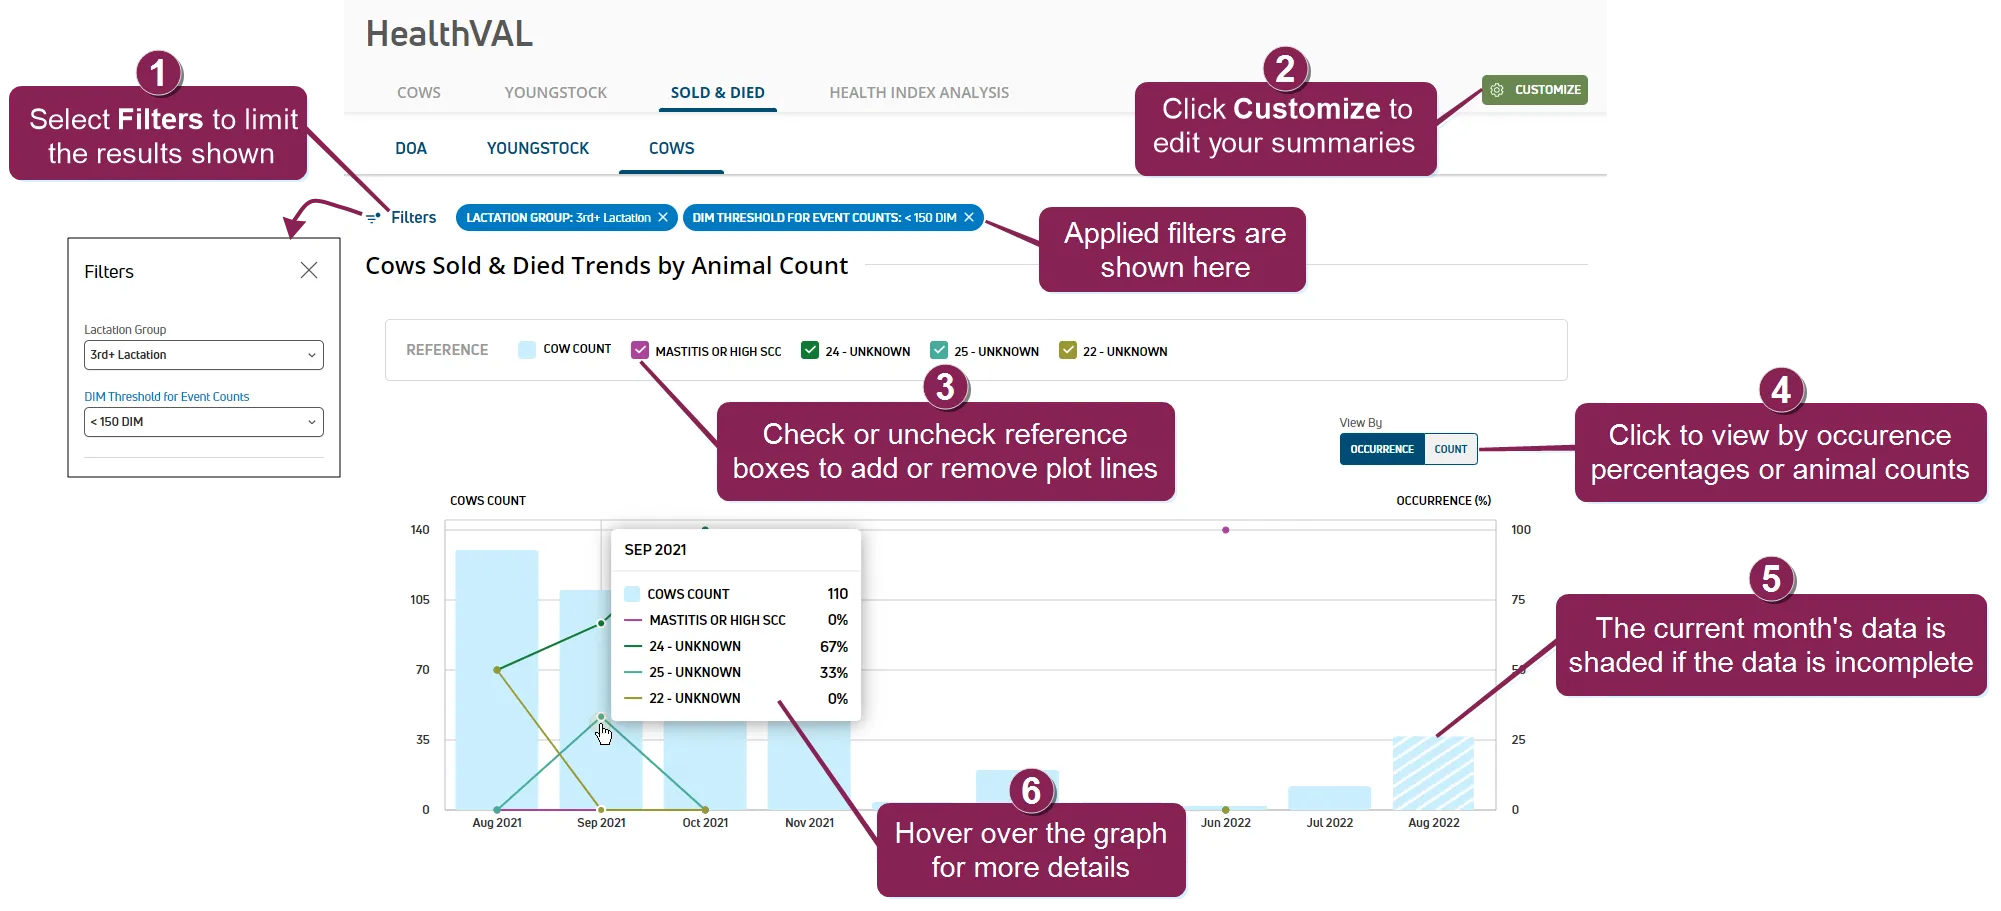
- Cows: Cows sold and died by lactation group and/or DIM threshold.
See the topics below to learn more:
- Select Filters to open a side panel on the left of the page to filter the list of calves by reporting frequency and calf age (in days). Once a filter is selected, the current filter applied is displayed next to the Filters option. Click the X on a specific filter to remove it.
- Click the Customize button to edit your HealthVAL summaries for cow and heifer events and/or modify your HealthVAL benchmark settings.
- Reference checkboxes allow you to control which lines are plotted on the graph. Each reference is color-coded to match a specific bar or line on the graph. Check a box to include a plot line on the graph. Uncheck a box to remove a plot line from the graph.
- Click Occurrence to view the reference data in occurrence percentages and include threshold values on the graph, or click Count to view the reference data in total counts.
- If the graph includes data for the current month, the bar is shaded to indicate that data for the month is incomplete.
- Hover over a bar on the graph to view additional data.