Health Index Analysis
1 min
Use the Health Index Analysis page to review animals that exceed your herd's Health Index Threshold, which is set on the Customize > Benchmark SettingsCustomize > Benchmark Settings page.
Animals with a higher Health Index have been diagnosed with more health events than others of similar age, and this summary allows you to quickly identify animals that may need to be culled. For instance, if an early-lactation cow has already had multiple cases of mastitis, her index value will be high, and you may determine that she is susceptible to illness and decide to sell her.
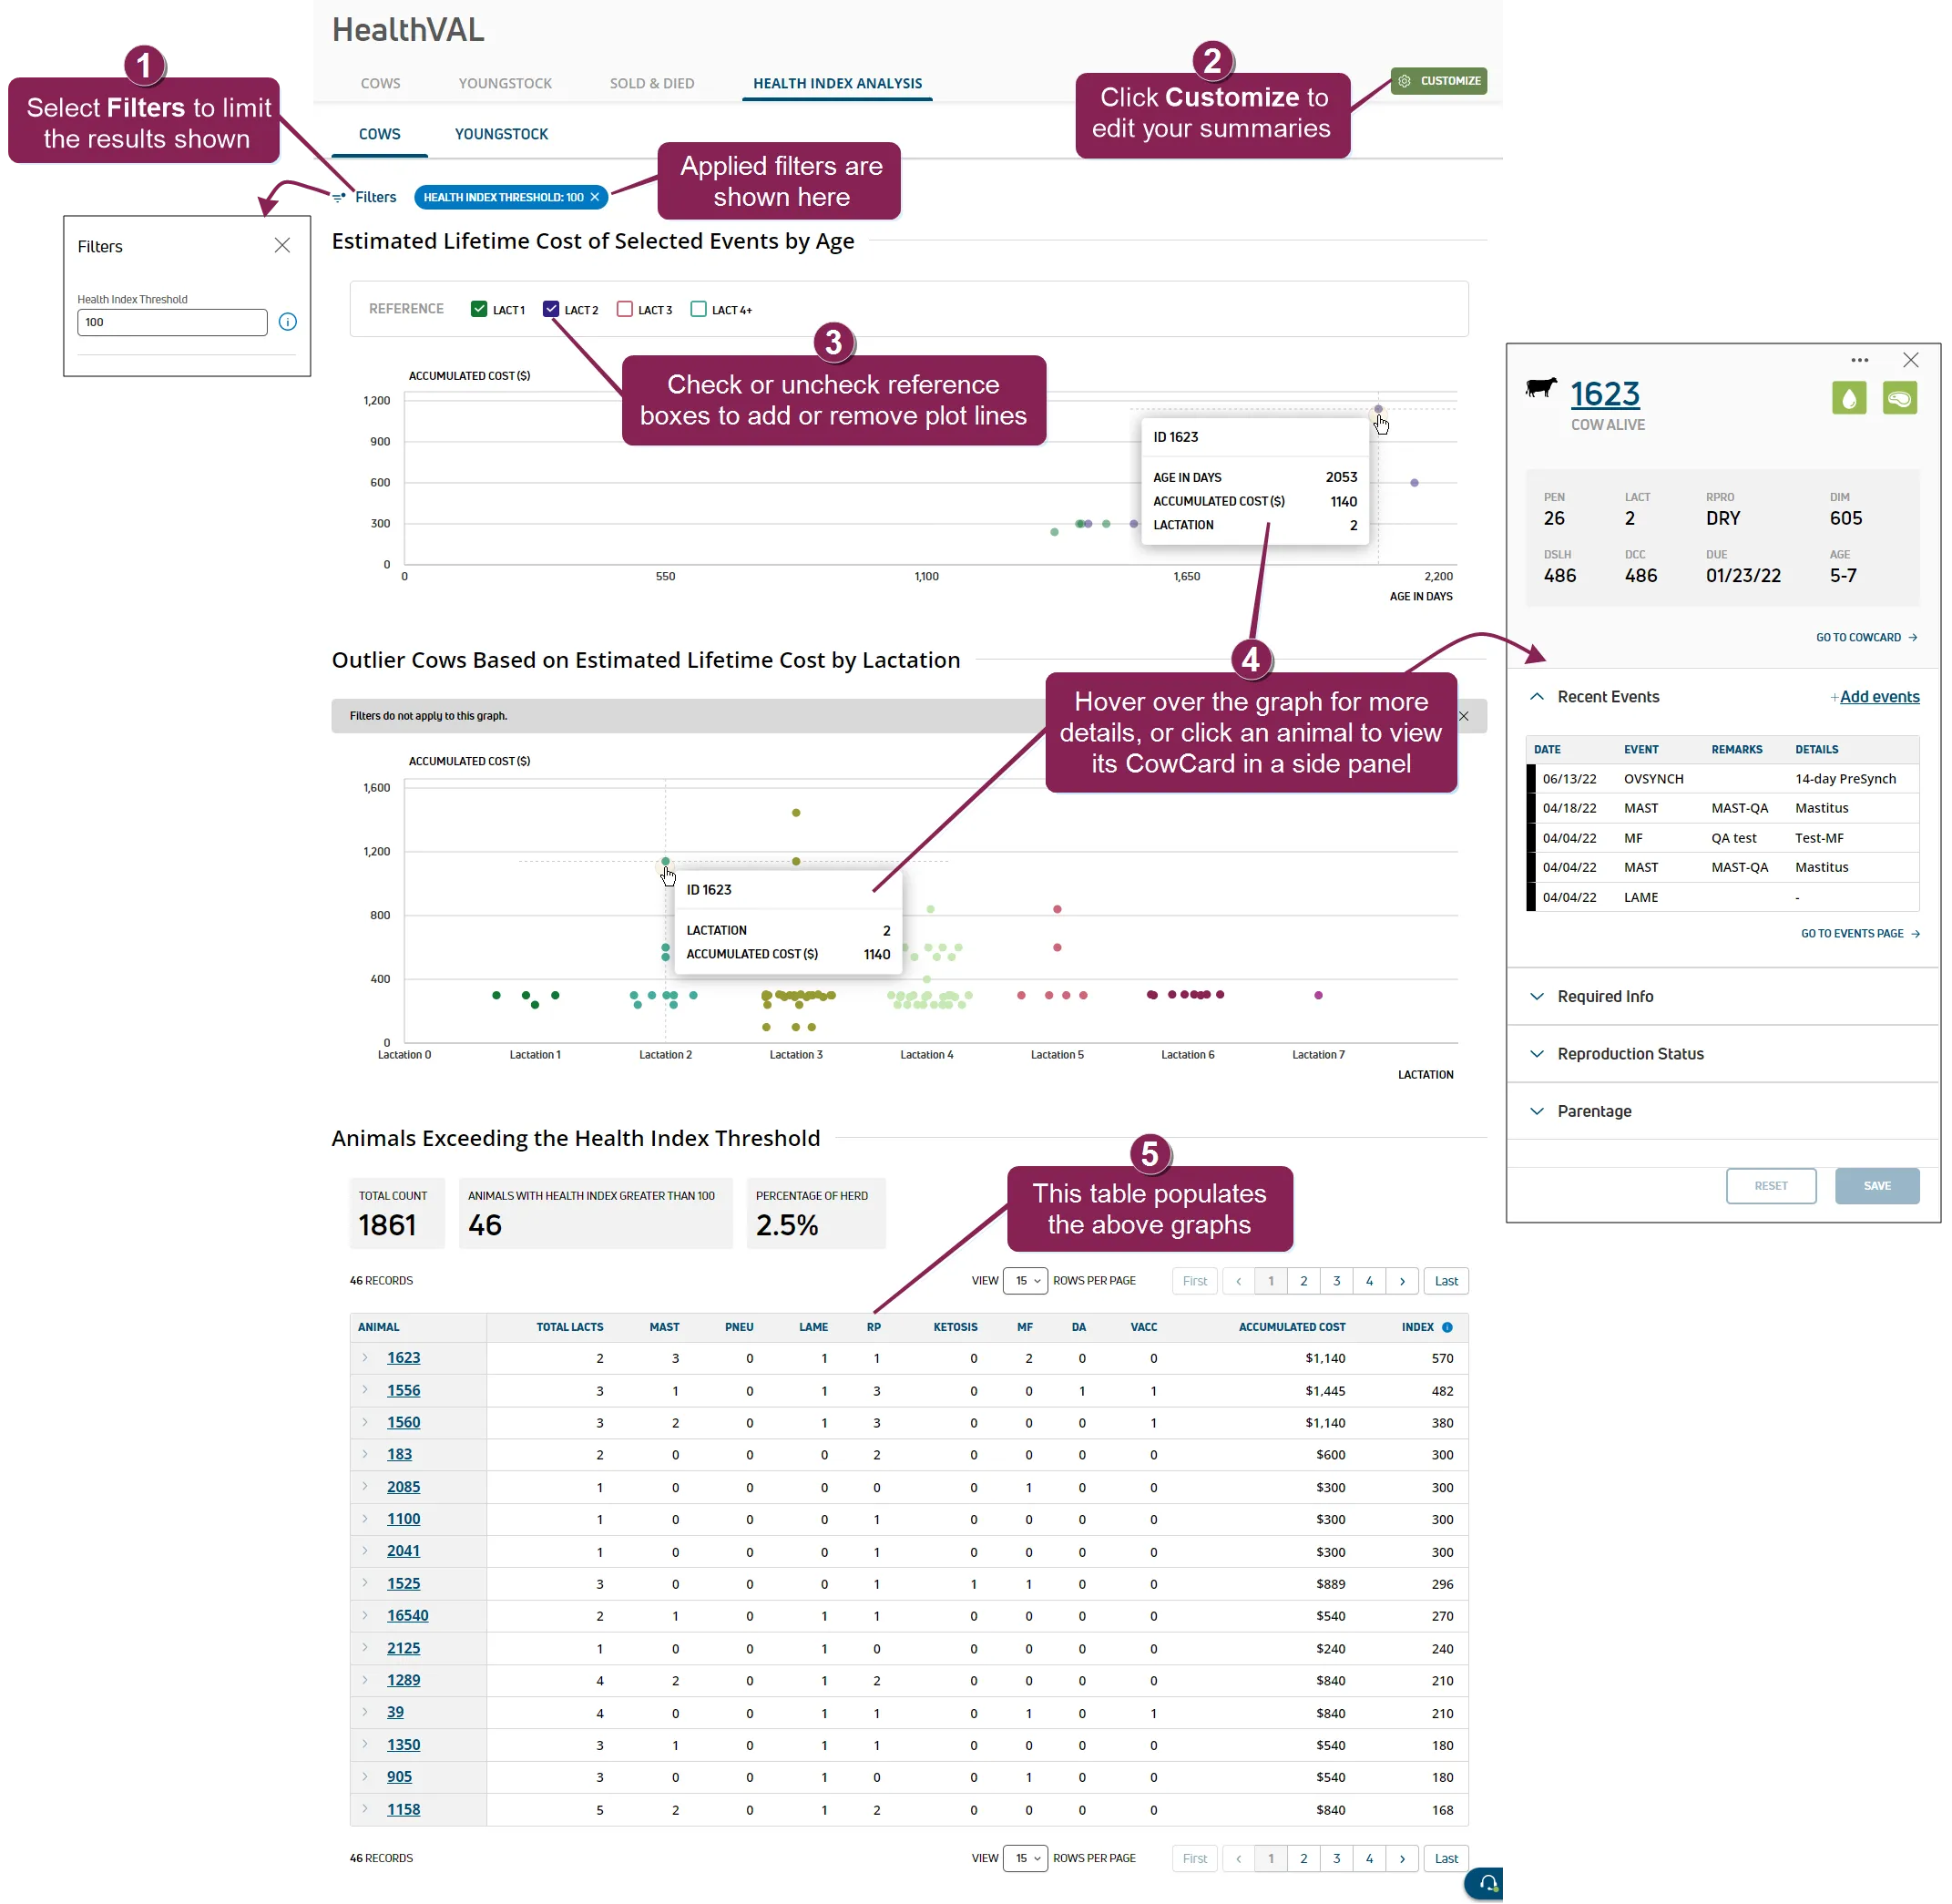
- Cows: Health Index Analysis data for all cows by month.
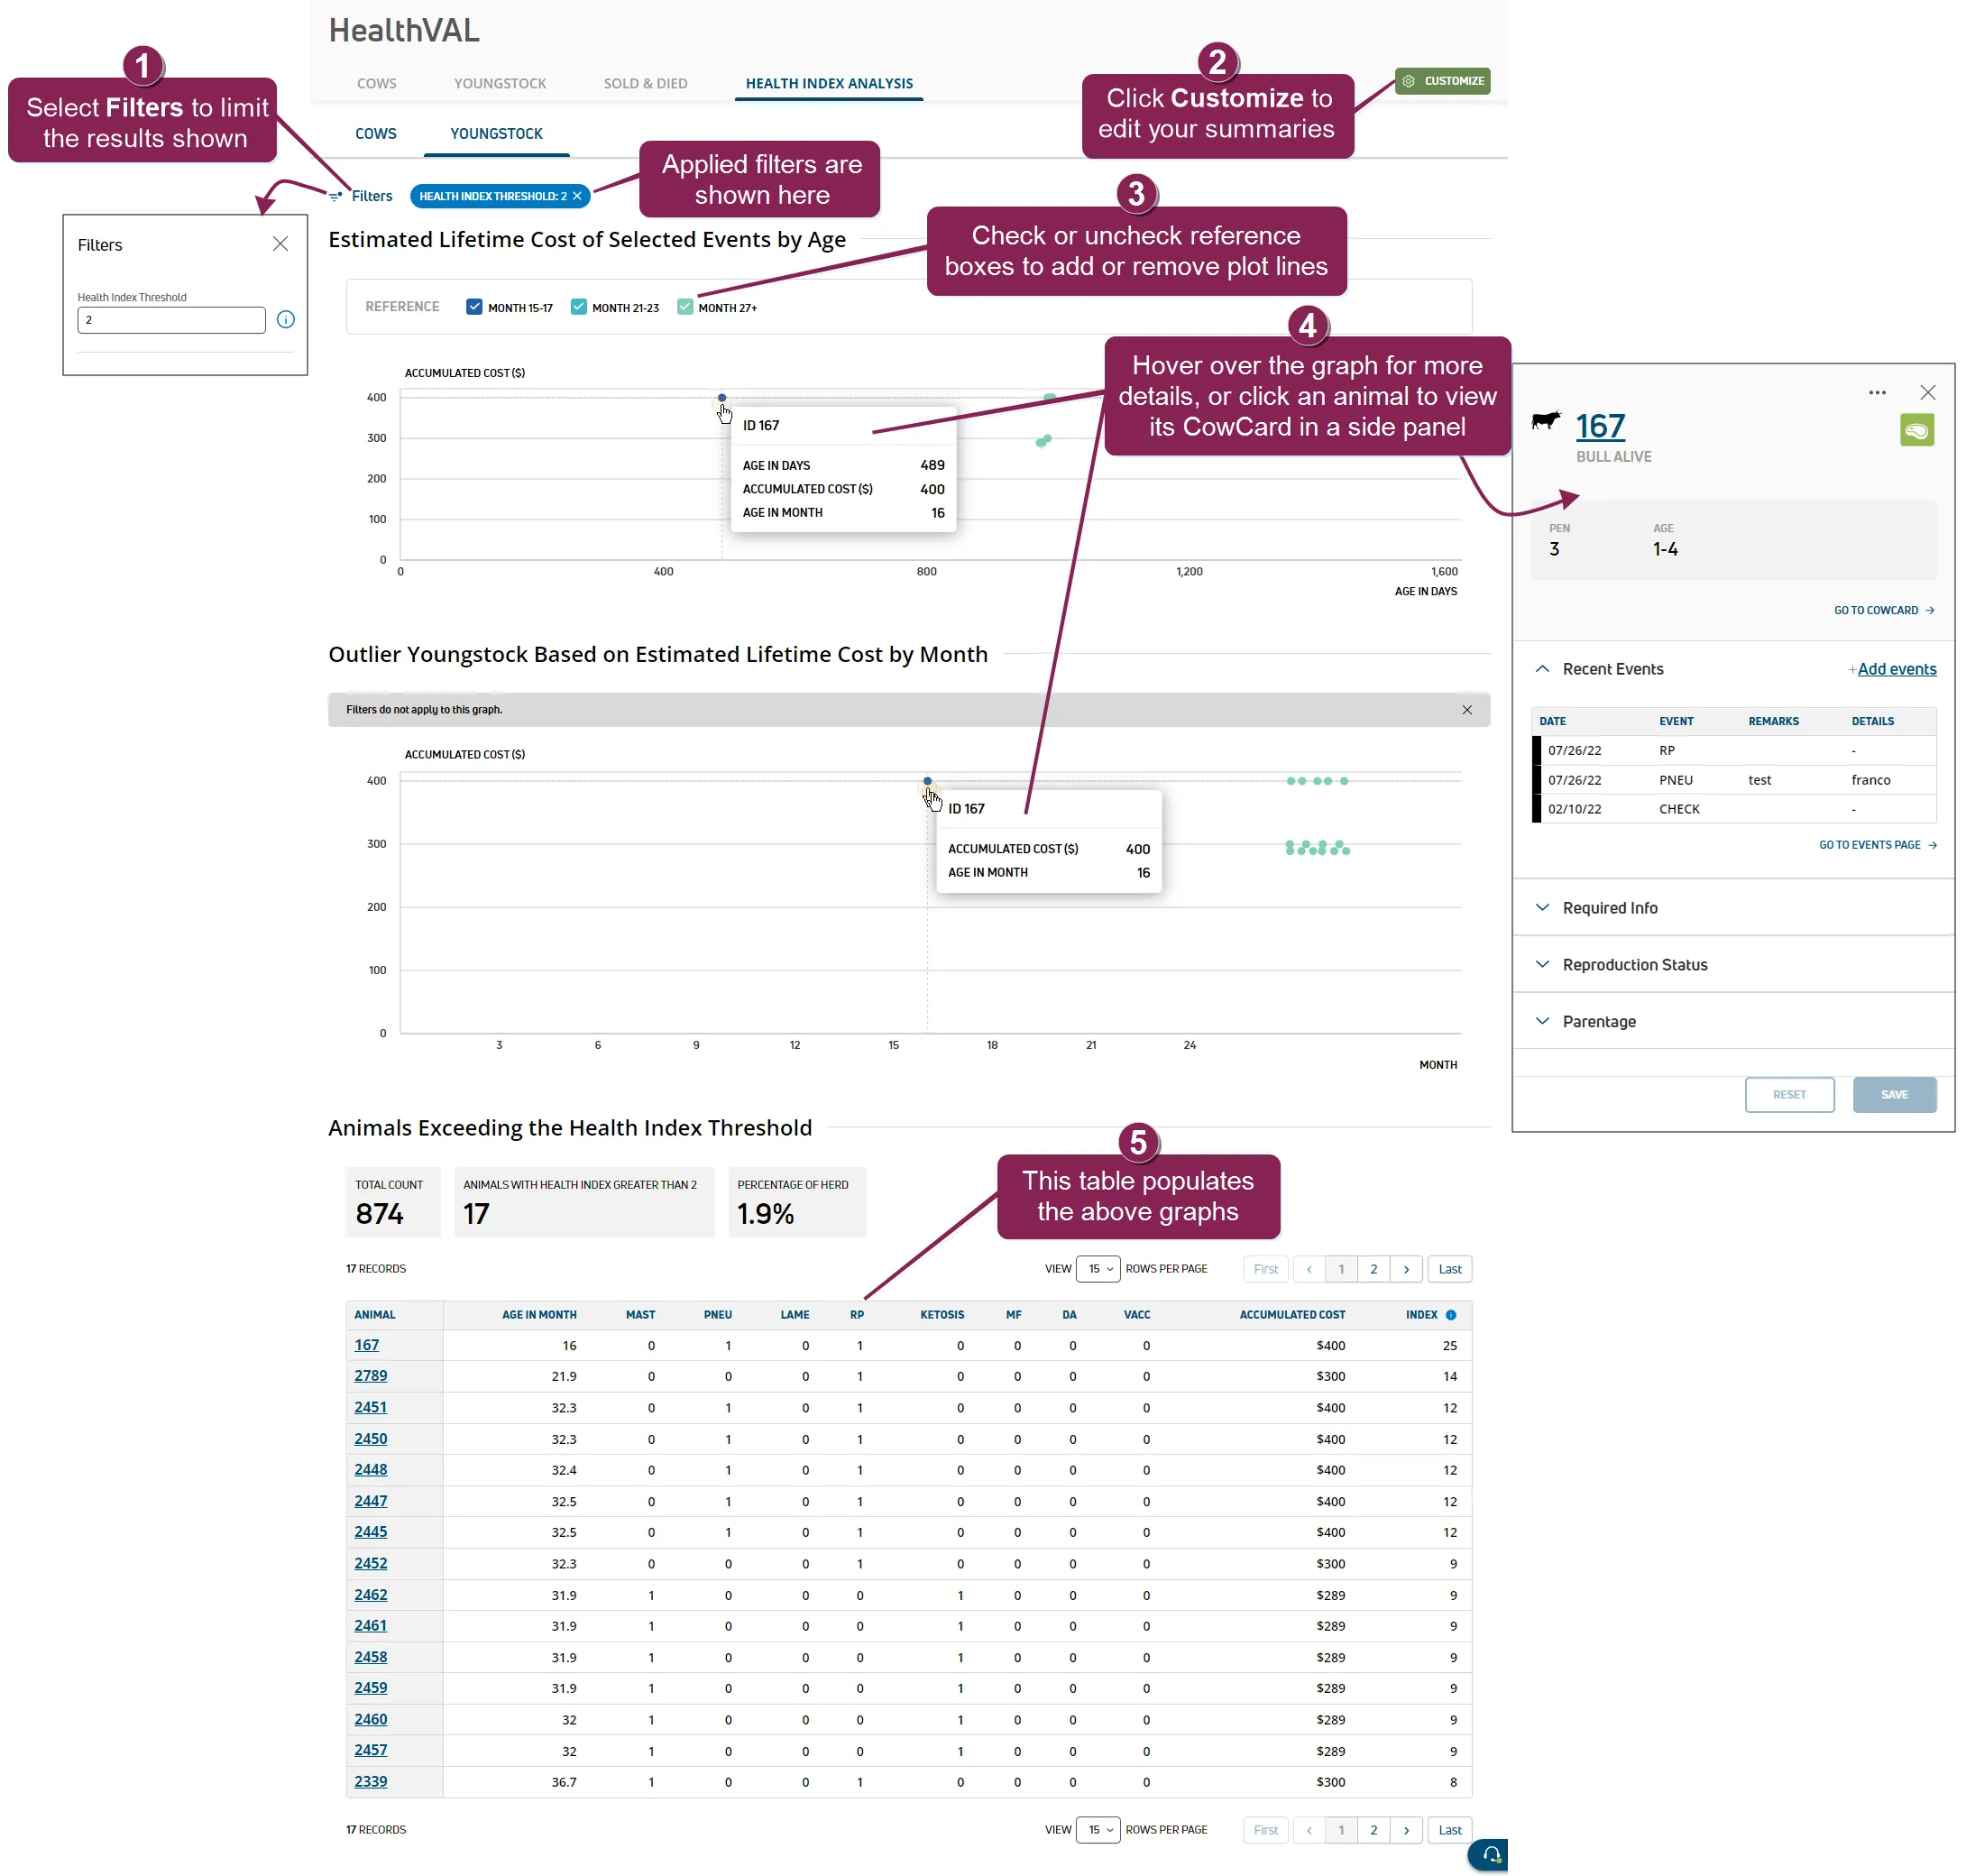
- Youngstock: Health Index Analysis data for all youngstock by month.
See the guidelines below when reviewing your Health Index Analysis summary:
- Select Filters to open a side panel on the left of the page to filter the list of animals using a threshold value. Once a filter is selected, the current filter applied is displayed next to the Filters option. Click the X on a specific filter to remove it.
- Click the Customize button to edit your HealthVAL summaries for cow and heifer events and/or modify your HealthVAL benchmark settings.
- Reference checkboxes allow you to control which lines are plotted on the graph. Each reference is color-coded to match a specific bar or line on the graph. Check a box to include a plot line on the graph. Uncheck a box to remove a plot line from the graph.
- Hover over an animal's data point on the graph to view additional details. Or, click the animal's data point on the graph to open a side panel and view even more details about the animal, including recent events. See View Animal Details to learn more about the information displayed in the side panel.
- Scroll down to view the graphed data in a table format.