Visualize Historical Measurements with EPLOT
3 min
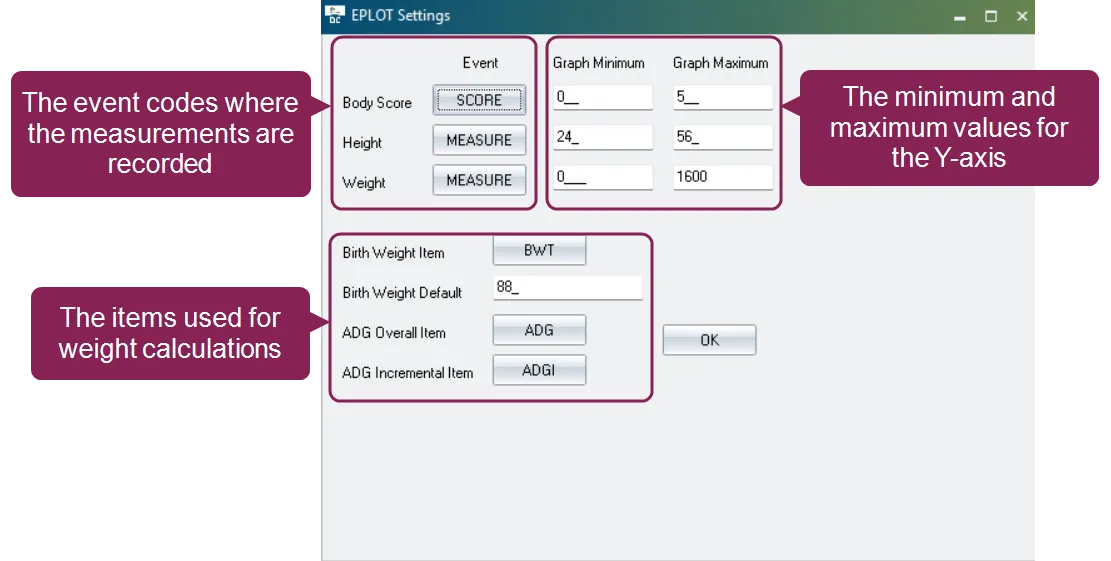
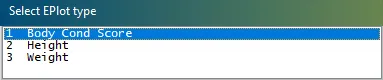
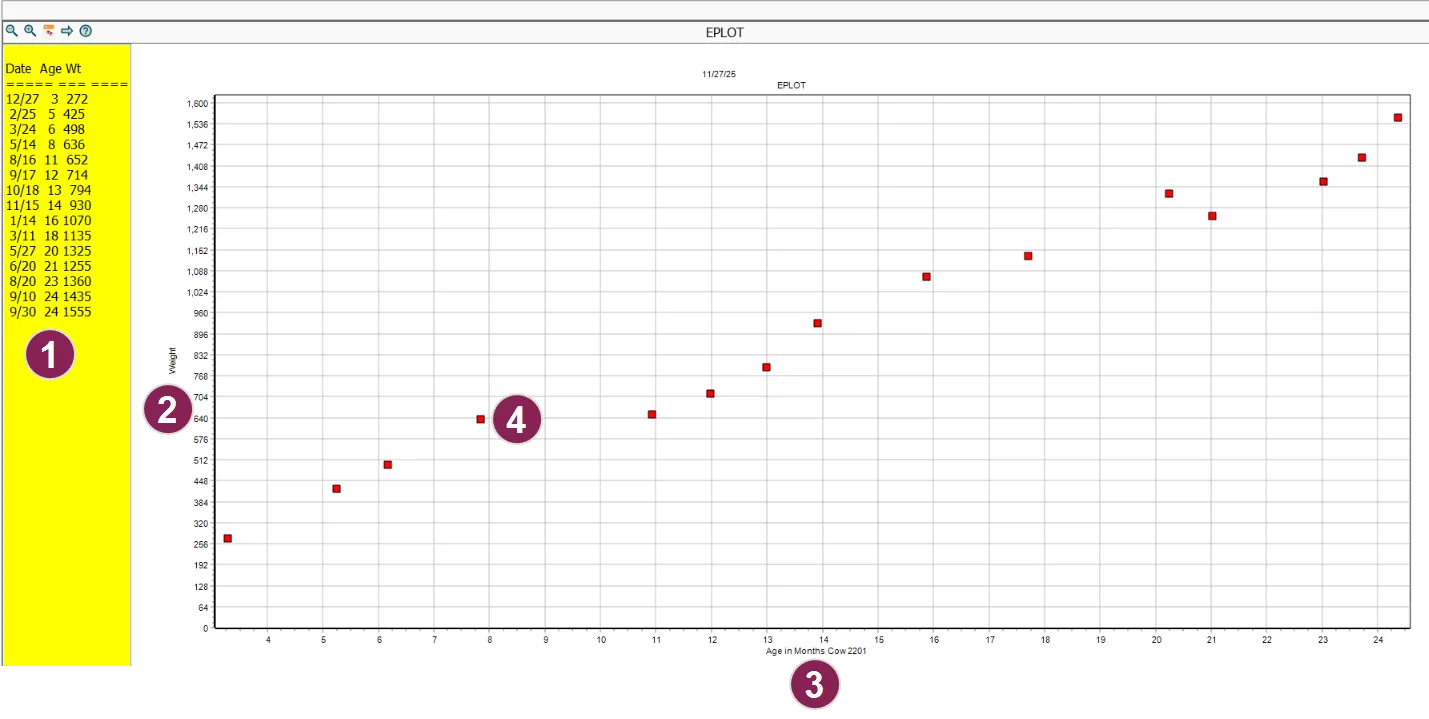
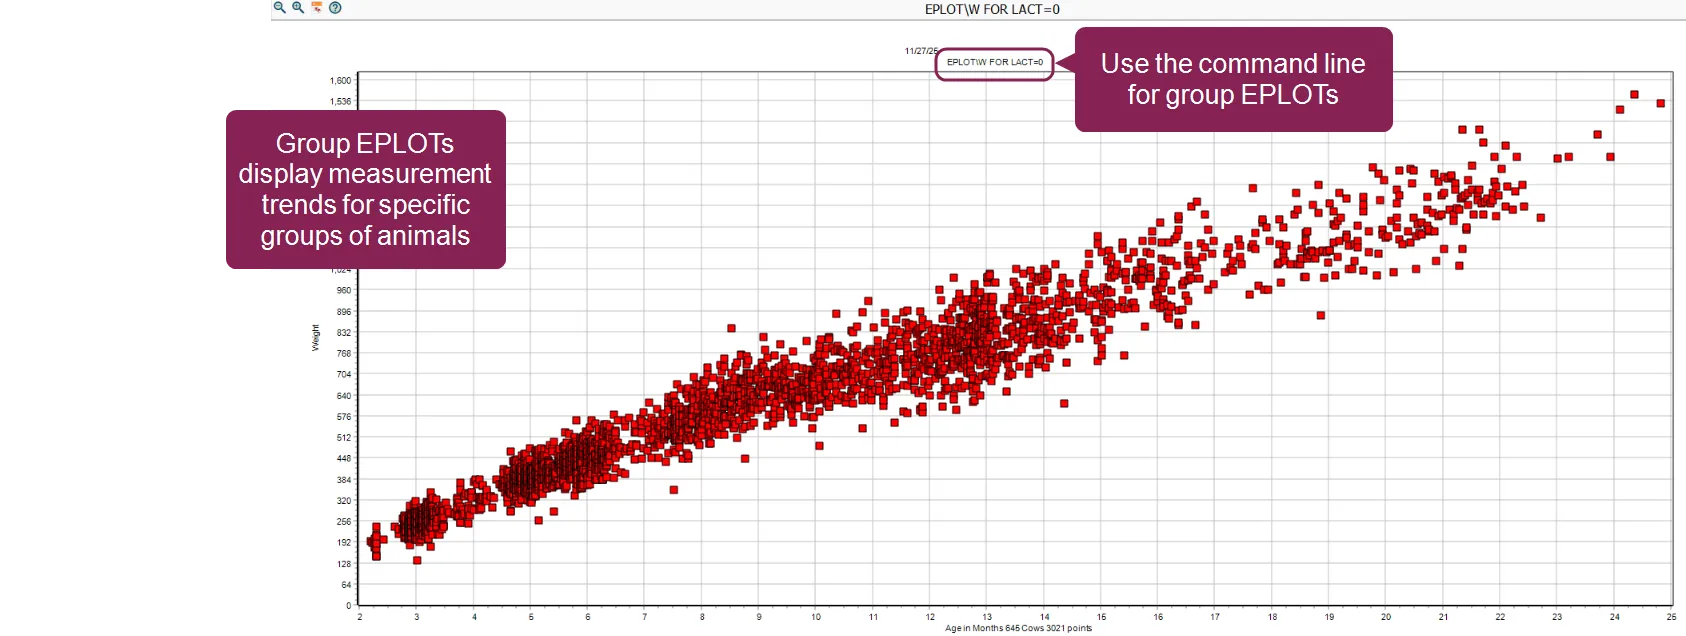
\<font color="#67854e"> question \</font> how can i analyze the historical trend of measurements like body condition score (bcs), weight, or height for individual animals or groups in dairycomp? \<font color="#67854e"> answer \</font> use the eplot command to display the historical progression of specific numeric measurements that have been recorded in the remark field of events eplot provides visual analysis for three types of animal measurements over time body condition score weights heights the historical data for these plots is typically sourced from the bcs (body condition score) event docid\ ypec bncraweojwivylqr and the measure event docid\ ypec bncraweojwivylqr the specific event codes used for each measurement are defined in the eplot settings docid\ lceecsltprza9pf tuon8 ( eplot\m ) why track body condition score? body condition scoring provides an objective estimate of an animal’s nutritional status and is linked to health and breeding success poor body condition scoring during transition periods increases disease risk and reduces reproductive performance eplot helps visualize these trends over time eplot differs from standard graphing commands because it plots the numeric value found in the remark field of a specified event (for example, the body condition score recorded in the bcs event) don't confuse eplot with the or egraph functions docid\ rhzbb3lboeiok rljsku8 plots current numeric item values (for example, milk) egraph docid\ wz70pt9vc4zc9r0pbk2dm plots the frequency of events over time (for example, mast count) eplot plots historical measurements saved in the remark field over time \<font color="#f97316"> important \</font> because eplot reads from the remark field, that data must be correct the numeric value entered into the remark field for body condition score, weight, and height is always processed as two decimal points (for example, 4 20 or 2 40) for body condition score, a value of "1" is processed as 1 00 and a value of "4 2" is processed as 4 20 configure eplot settings before running the eplot command, you must configure dairycomp to link the correct events to the measurements you wish to plot this configuration setup will then apply to all three measurement types (i e , body condition score, height, weight) to open the eplot settings window, enter eplot\m in the command line note if you run the simple eplot command without first defining these settings, dairycomp may automatically open the eplot settings window, as the source events for the data are required before analysis can proceed once settings are saved, this window must be accessed using eplot\m in the window, enter the settings as instructed below, then click ok to save them \<font color="#67854e"> event \</font> defines the specific event codes where the measurements are recorded (for example score for body condition score, measure for height and weight) this is crucial for dairycomp to find the historical data \<font color="#67854e"> graph range (min/max) \</font> sets the minimum and maximum values for the y axis this standardizes the appearance of all future graphs of that type (for example, a bcs range of 0 to 5) \<font color="#67854e"> weight/adg specific settings \</font> defines the item names (bwt, adg, adgi) used for average daily gain (adg) calculations applies only to weight analysis birth weight item the dairycomp item name (typically bwt) used to record an animal's actual birth weight if this item is populated, it's used as the starting point for adg calculations use item type 1 or 17 for birth weight item to record the integer value birth weight default the value dairycomp should assume as a standard birth weight if the animal's birth weight item is empty adg overall item the dairycomp item name (typically adg) where the calculated overall adg is stored when using the \s switch overall adg is calculated from the animal's birth weight to its most recent recorded weight use item type 22 for adg overall item, which provides a two decimal place value suitable for growth rate adg incremental item the dairycomp item name (typically adgi) where the calculated incremental adg is stored when using the \s switch incremental adg is calculated between the last two recorded weight events use item type 22 for adg incremental item, which provides a two decimal place value suitable for growth rate \<font color="#f97316"> important \</font> you may need to create the specific event or item types in order to record and track the data for eplot for example, if you don't have already have an item for adg, you'll need to create it before you can select it in the eplot settings window see alter9 events docid 8 yopecfyeksw0dkfyism and alter2 item definitions docid\ elh0 fj ktf5ihc3rhfig for more information run eplot from the selection window you can run the eplot function using a selection window to choose your analysis parameters (i e , the type of graph and the animal id ), or you can add these parameters to the eplot command directly in the command line note the selection window method only works for analyzing individual animals for group eplot analysis you'll need to use the command line to run eplot from the selection window in the command line, enter eplot a selection window displays asking you to choose the type of graph to create choose an eplot type from the window a window displays asking you to input the id for the animal you want to analyze enter the id for the animal you want to analyze once you've chosen the plot type and animal id, the individual animal plot docid\ lceecsltprza9pf tuon8 displays individual animal plot the individual animal graph is the default output when running eplot for a specific id it provides a visual history of that animal’s measurement trend over time the x axis (time axis) in eplot is fixed and cannot be changed, as it is determined by the biological relevance of the measurement \<font color="#67854e"> body condition score \</font> always plots against days in milk (dim) to analyze condition loss/gain during lactation \<font color="#67854e"> weight or height \</font> always plots against age (in days or months) to analyze growth rates and heifer development below is an example of an eplot for weight for animal id 2201 the plot consists of the following key components \<font color="#67854e"> data panel \</font> the yellow panel on the left of the plot displays the dates and exact measurements for the plot data \<font color="#67854e"> y axis \</font> displays the measurement value (for example, score for bcs, height , or weight ) the range is set in the eplot settings ( eplot\m ) \<font color="#67854e"> x axis \</font> displays the fixed time interval based on the measurement plotted (dim for bcs, age for weight/height) \<font color="#67854e"> data points \</font> each point on the graph represents a single recorded measurement (from the event remark) to investigate the source of a specific data point, double click the applicable point on the graph dairycomp automatically switches to the animal's cowcard, which displays the detailed record view you can then check the event history to see the original date and value entered run eplot from the command line the command line is the fastest way to run and customize an eplot analysis it is also the required method for generating group (i e , composite) plots the basic structure for running eplot from the command line is eplot measurement switch] for \[condition] \\\[other switches] measurement selectors to run an individual animal plot from the command line, use one of the measurement selector switches and specify an animal id the measurement selector switches include \c for body condition score \h for height \w for weight for example, to view a weight plot for an animal with id 1234, run eplot \w for id=1234 how to run a group plot from the command line the group (composite) plot generates a visual representation of the averaged measurement trend for all animals that meet a specified filter condition (for example, a specific lactation or pen) this plot is used primarily for benchmarking and herd level trend analysis, not for individual animal details to run a group plot, run the eplot command directly in the command line and specify a population filter using a for statement (which tells dairycomp to select multiple animals) for example, for heifer weight benchmarking, run eplot \w for lact=0 \w selects the weight measurement type for lact=0 filters the population to only include heifers (i e , lactation 0) or, to view a first lactation bcs trend, run eplot \c for lact=1 \b selects the body condition score measurement type for lact=1 filters the population to include only first lactation animals the resulting plot displays the collective, averaged measurement trend for all animals that meet a specified filter condition this group plot is used primarily for benchmarking and herd level trend analysis, not for individual animal detail the output shows the averaged trend over the fixed x axis (age for weight/height, dim for bcs) this trend may be displayed as a smoothed line or as a series of averaged data points, depending on the data density common command line switches you can combine multiple switches at the end of a command without any spaces (for example, \wag ) \ \<font color="#67854e"> a (adg average) \</font> calculates and displays the weight plot output as the average daily gain (adg) trend over time, instead of raw weight values applies only to weight (\w) analysis for example eplot \wa for lact=0 \<font color="#67854e"> \c (body condition score) \</font> selects body condition score (bcs) analysis for example eplot \c for id=1234 \<font color="#67854e"> \d# (date select) \</font> limits the analysis to include only data points within the last # days for example eplot \w for lact=0 \d365 \<font color="#67854e"> \f (filein scale data) \</font> used to import height and weight data from scales contact support for help in setting up the import \<font color="#67854e"> \g (global standards) \</font> adds the low and high standards lines to the graph must be used with height (\h) or weight (\w) analysis for example eplot \wg for lact=0 \<font color="#67854e"> \h (height) \</font> selects height analysis for example eplot \h for id=5555 \<font color="#67854e"> \m (eplot settings) \</font> opens the eplot settings configuration window for example eplot \m \<font color="#67854e"> \s (store adg items) \</font> calculates the overall adg (adg) and incremental adg (adgi) and saves those values into the animal's item record this command runs independently of the plot and should be set up in alter\6 to run daily \<font color="#67854e"> \t (tall mode) \</font> displays the graph output in tall mode \<font color="#67854e"> \w (weight) \</font> selects weight analysis for example eplot \w for id=9876 \<font color="#67854e"> \x (exchange) \</font> exchanges (fixes) height and weight values that were recorded in the wrong order \<font color="#67854e"> \x# (x axis max value) \</font> sets the maximum value for the x axis (age or dim) note this switch is also used with the exchange functionality above for example eplot \w for lact=0 \x400 \<font color="#67854e"> \y# (y axis max value) \</font> sets the maximum value for the y axis (measurement value) for example eplot \w for lact=0 \y200