Heifers: 21-day Pregnancy Risk
3 min
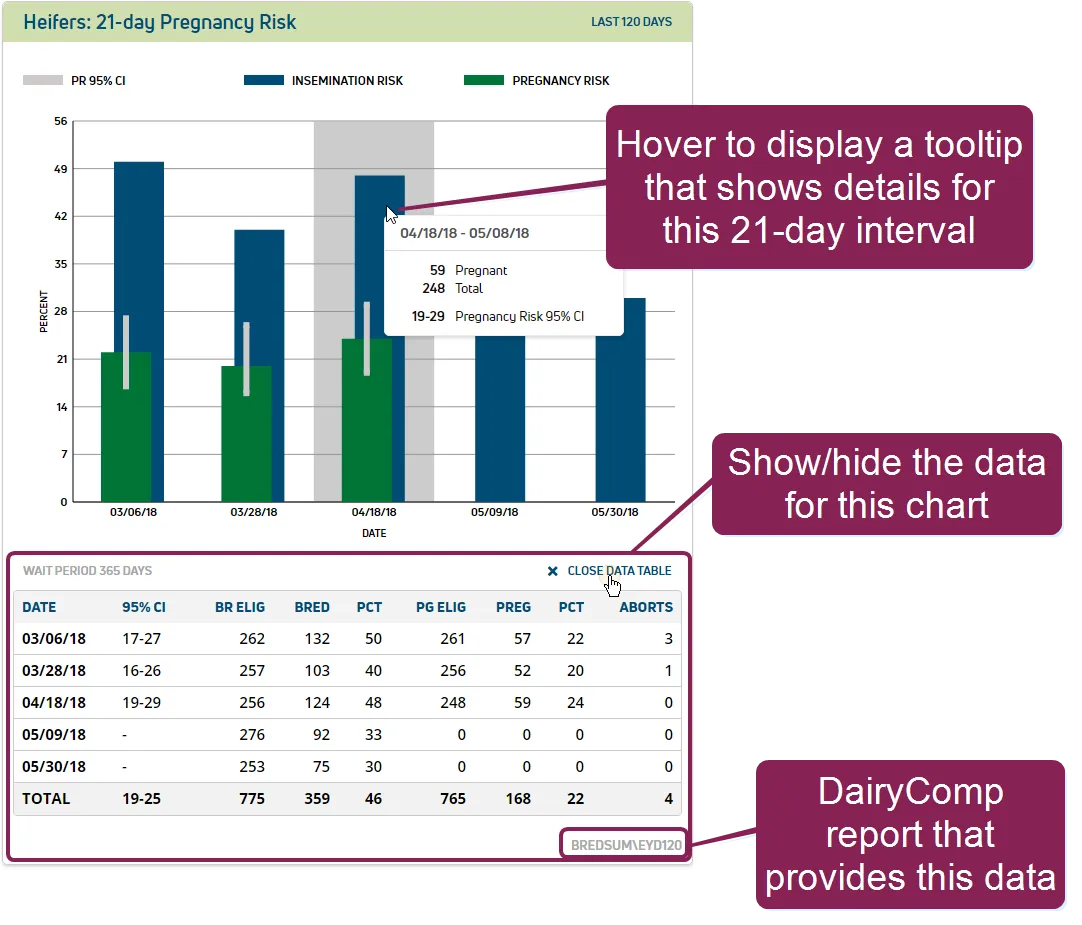
The Heifers: 21-day Pregnancy Risk widget charts the insemination risk, pregnancy risk, and confidence interval (CI) for recent 21‑day intervals. This widget reflects data only for heifers; there is another widget that shows this data for cowsthis data for cows.
Follow these guidelines when reviewing the data in this widget:
- The dates displayed beneath each bar in the chart represent the start date for each 21‑day interval.
- The dark blue bar represents the insemination risk.
- The green bar represents the pregnancy risk.
- The gray "wick" represents a 95% Pregnancy Risk (PR) Confidence Interval (CI), meaning that based on this data, you can be 95% confident that the results will fall within this range. For instance, if the wick reflects a 95% CI of 19-26, it means that you can be 95% confident in a resulting pregnancy rate of 19%-26%.
- Click the View Data Table link at the bottom right of the chart to view the specific data that builds the chart:
- DATE: Start date of each 21‑day interval.
- 95% CI: The lower and upper confidence limits (CLs). For example, a 95% CI of 19‑26 indicates that 19% is the lower CL and 26% is the upper CL.
- BR ELIG: The number of animals entering the 21-day interval that are eligible to be inseminated.
- BRED: The number of animals actually inseminated.
- PCT: The percent of animals detected in heat (calculated by BRED / BR ELIG).
- PG ELIG: The number of animals entering the 21-day interval that are eligible to become pregnant.
- PREG: Number of pregnancies.
- PCT: Percent of pregnancies (calculated by PREG / BR ELIG).
- ABORTS: The animals that were confirmed pregnant but later lost the pregnancy.