Cow Event Analysis
Cow Event Analysis graphs allow you to focus on individual events for specific lactations or days in milk, and are an invaluable resource for tracking and investigating your herd's unique health profile in greater detail. The graphs are located on the CowsCows page, below the main trends graph.
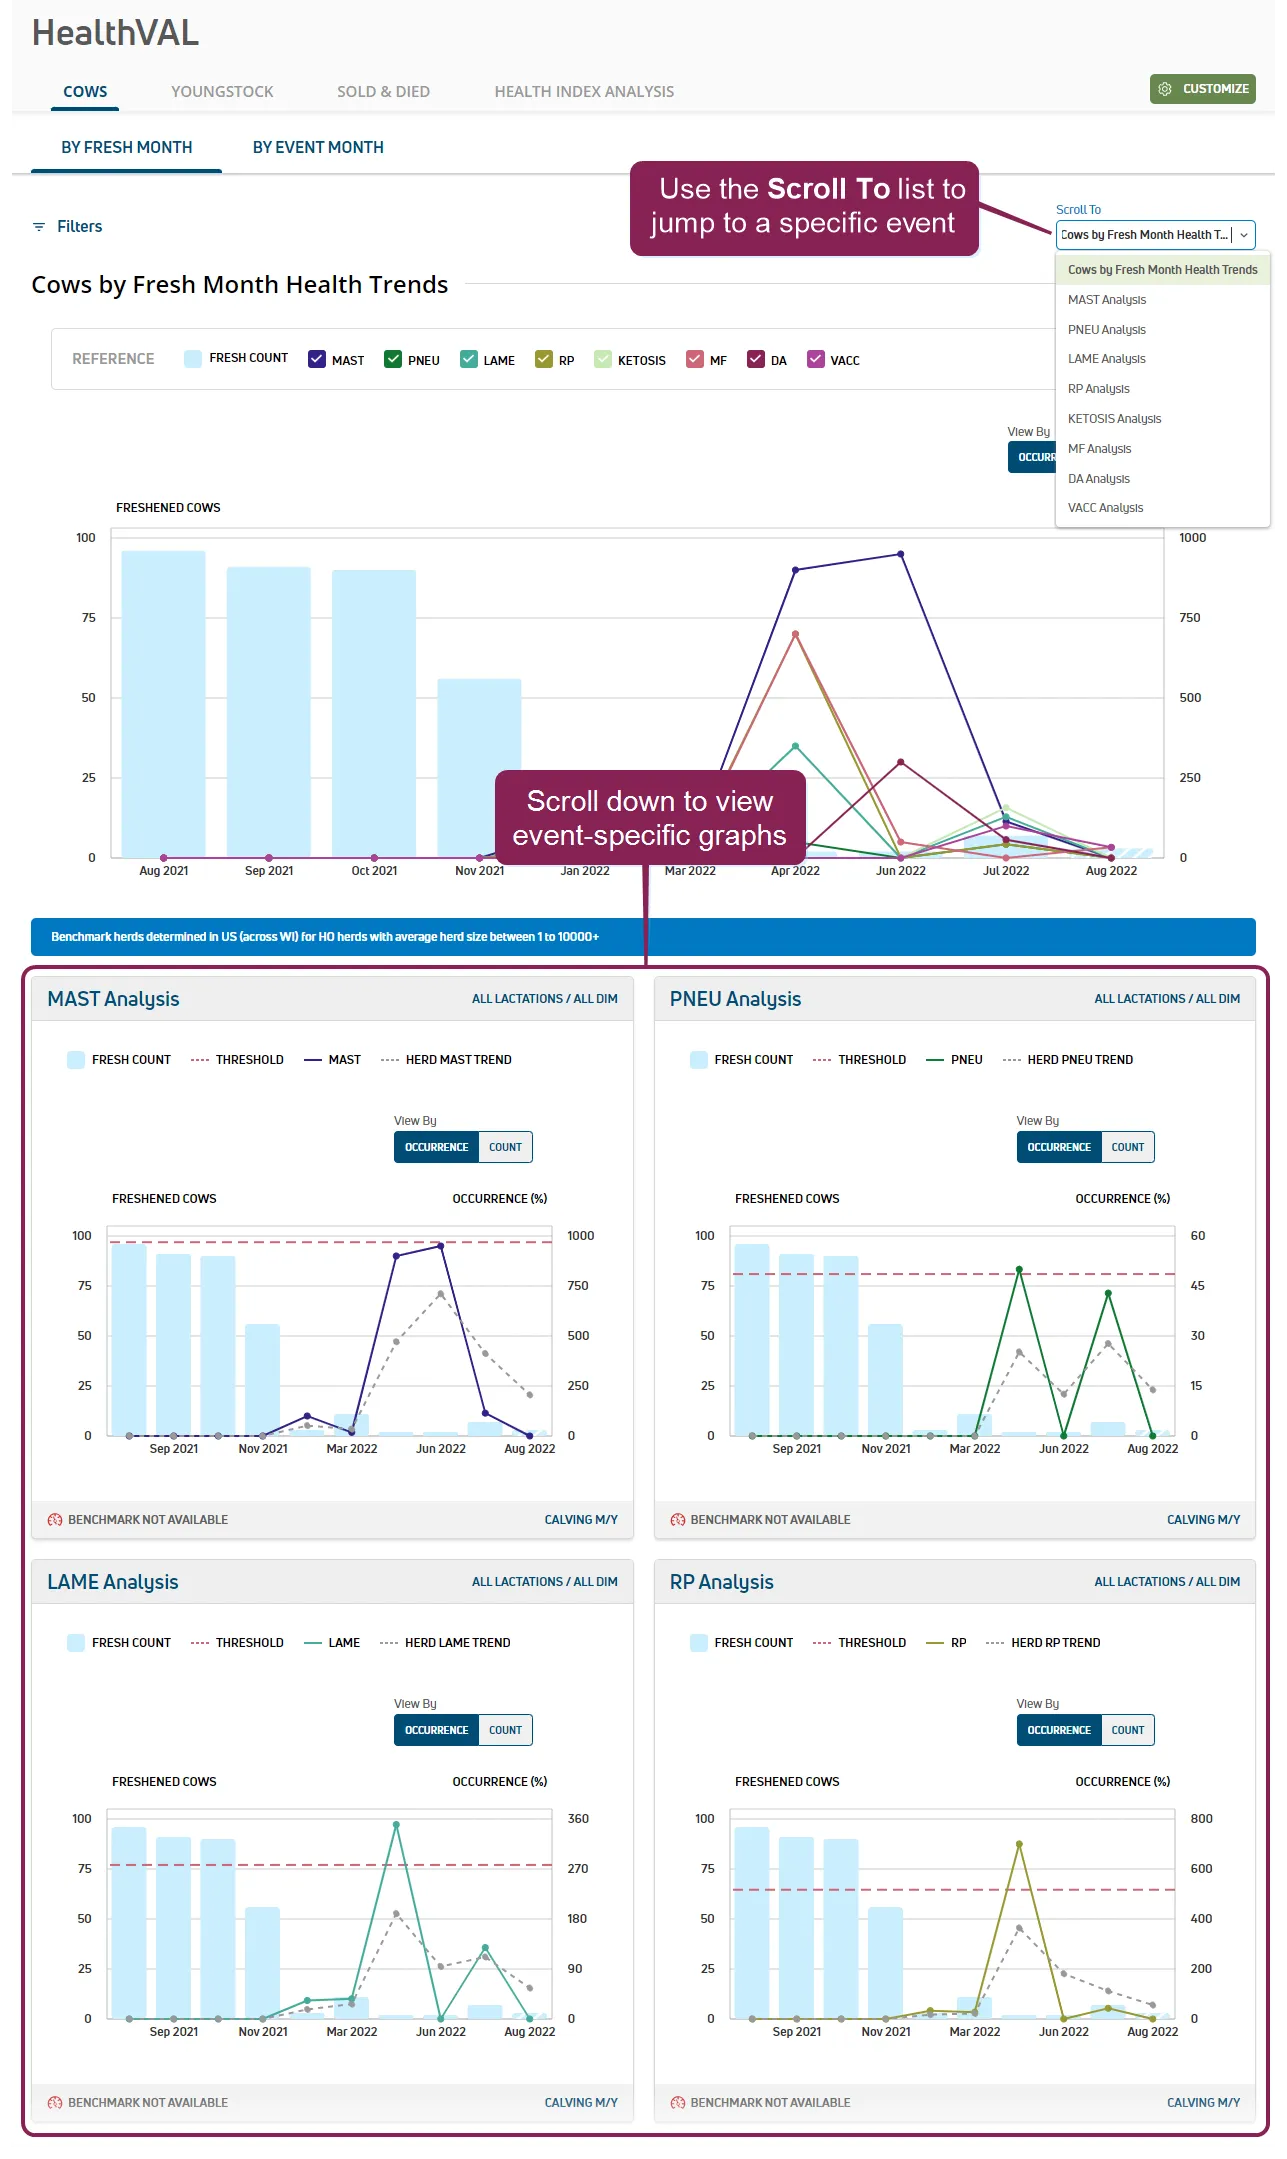
Follow the guidelines below when working with Event Analysis graphs.
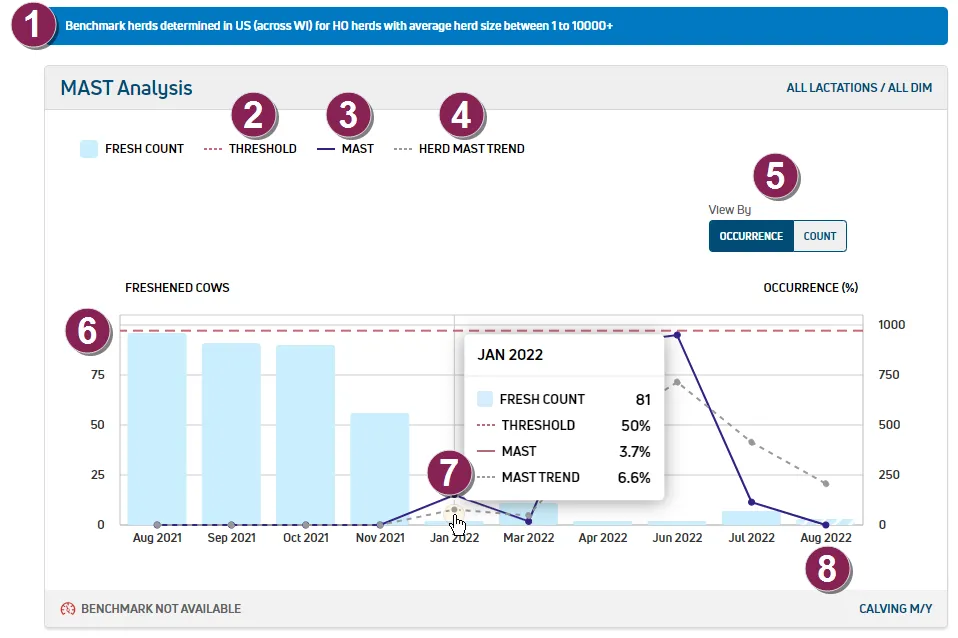
NOTE: This example above shows a MAST event, but the same guidelines apply to all events.
Benchmark assigned: Based on your customization settingscustomization settings, your cows are compared to herds of similar locale and size. The blue bar identifies the benchmark details.
Event line: Use the solid colored line  to view total cases and percentage (%) of affected cows by month. The light blue bar indicates the total number of cows, and hovering over the graph provides details by month.
NOTE: For quick association, the HealthVAL line color matches the color currently defined for the event. See Edit Event Definitions for more information.
Herd Event Trend: Use the gray dotted line  to follow the trend curve for your herd.
Event Bench: If benchmark data exists, you can compare your herd trend curve to the benchmark curve  . If benchmark data is not available for your location and herd size, a
  message displays below the graph.
Click Occurrence to view the reference data in occurrence percentages and include threshold values on the graph, or click Count to view the reference data in total counts.
Threshold: The red dashed line  indicates your threshold for this event. You can set custom thresholds in Event Definitions.
Hover over a bar on the graph to view additional data.
If the graph includes data for the current month, the bar is shaded to indicate that data for the month is incomplete.