Why does my reproductive data seem random?
If you flip a coin, what are the odds of landing on heads? How about tails?
While you might expect a 50-50 chance, Dr. Paul Fricke, Professor of Dairy Science and Extension Specialist in Dairy Cattle Reproduction at UW-Madison, shares why that expectation isn’t always realistic. In a recent VAS webinar, he described an experiment by John Kerrich, who tested this assumption by flipping a coin repeatedly. When Kerrich flipped it just 10 times, heads came up 40% of the time. As he continued, results fluctuated – reaching over 55% and then dipping to 45% at 100 flips. It wasn’t until he flipped the coin 1,000 times that the results hovered closer to the anticipated 50-50 split.
So, why does this matter? For dairy farmers, it highlights an important lesson rooted in the Law of Small Numbers, a principle that sheds light on why your reproductive data can sometimes appear random.
Why repro data is like a coin toss
We’ve all been there – you finish a preg check, and the results week to week feel about as unpredictable as a coin toss. But before jumping to conclusions, it’s worth taking a step back. Just like in Kerrich’s experiment, evaluating reproduction data from a small sample size can lead to skewed conclusions. Dr. Fricke explains that when you focus on only a few data points, any pattern can appear exaggerated, creating a “small sample size effect.” This effect can easily mislead farmers into making decisions based on a snapshot that doesn’t accurately reflect the bigger picture.
Consider a 150-cow farm, for example. If one week’s conception rate comes in lower than expected, only to improve the following week, it may seem like there’s significant fluctuation. But often, these variations are simply due to the limited sample size and don’t necessarily indicate a true trend in reproductive performance.

How this impacts your decision-making
Dr. Fricke cautions that relying on small data samples can lead to hasty and even unnecessary changes. He suggests evaluating reproductive performance over a larger sample size instead. By analyzing more data points over time, you’re more likely to identify actual trends and avoid adjustments that may not genuinely benefit your herd.
Here are some tips to guide effective reproductive analysis:
Give your data time to tell the story. Focus on long-term trends rather than short-term fluctuations. The smaller your farm, the more time it takes for your data to accumulate and accurately reflect meaningful patterns.
Avoid frequent management changes. Making too many adjustments at once can make it difficult to assess the impact.
Expect variation. No matter the size of your dairy, minor fluctuations are normal. Focus on broader patterns rather than individual weeks or small sample sizes.
Take it a step further. Want solid evidence that changes to your reproductive program are actually effective? If possible, Dr. Fricke recommends running a randomized controlled trial, comparing a control group and an experimental group, to confirm whether the adjustment drives an actual change.
Leverage DairyComp to see the bigger picture
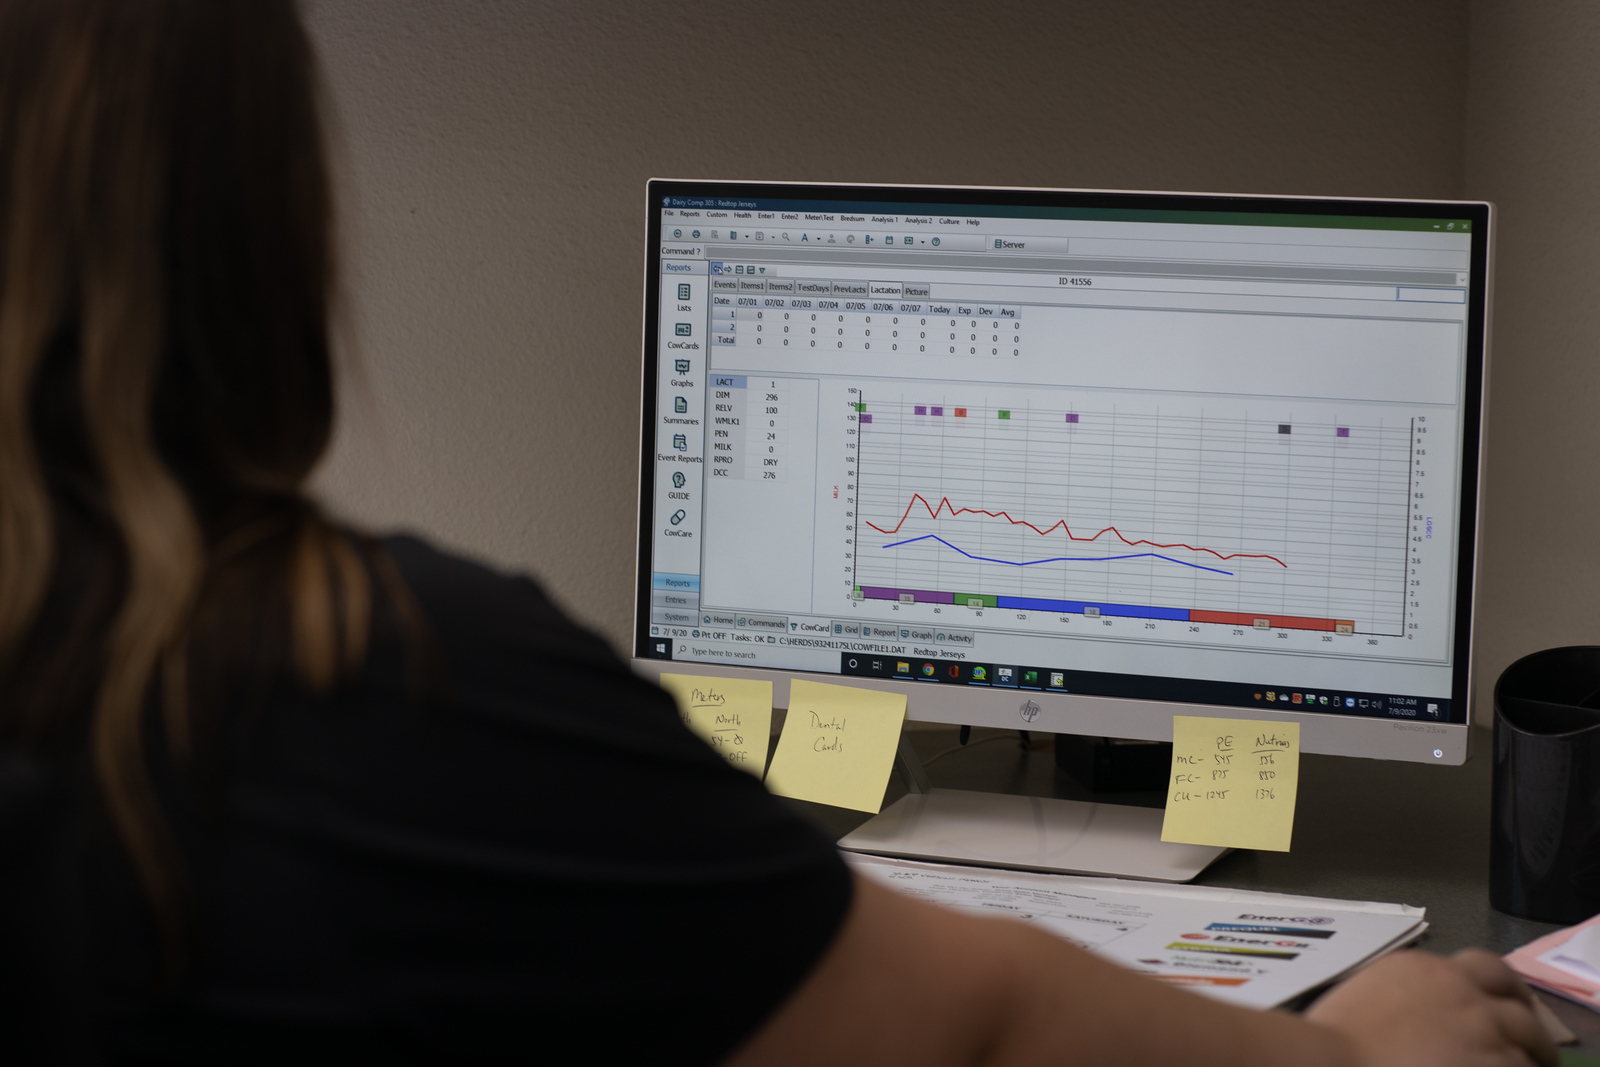
Craig Walter, VAS senior educator, recommends using DairyComp’s BREDSUM reports to gain a thorough understanding of your herd’s reproductive metrics. BREDSUM allows you to track essential data, like breeding counts, conception rates, pregnancy status, abortions and more. With DairyComp, you can also apply filters to analyze these metrics by specific factors like breeding technician, protocol or sire – helping you customize the data to dig into the metrics you want. DairyComp’s flexible reporting options offer both tables and color-coded graphs, making it easy to view the data your way.
Reproduction Insights is another tool available to DairyComp users through VAS PULSE Platform, bringing real-time insights to your fingertips for more accessible and precise reproduction management. With Reproduction Insights, you can see the big picture of your herd’s performance and zero in on areas where there may be opportunity to improve. You can even set custom thresholds for reproduction metrics, and if they deviate, the system will alert you, so you can proactively address potential issues.

Have questions about evaluating your herd’s reproductive data in DairyComp? Reach out to the VAS support team for personalized guidance on your reproductive analysis.
Not a DairyComp user but curious how it could improve your herd management? Get in touch below, and our team will reach out to discuss your farm’s needs and goals.