Using DairyCOMP to Assess the Potential Impact of Heat Stress on a Dairy
Written by Theodore Halbach, Maria Fuenzalida Valenzuela and Lyssa Seefeldt
A part of University of Wisconsin-Madison Heat Stress program.
Signs of Heat Stress
Dairy producers often struggle to quantify the impact of heat stress on their operations. The ability to use dairy management records to identify seasonal trends is critical to assess potential heat stress related losses. Diving into a dairy’s herd management software can help a producer quantify where the losses are occurring and, with some easy calculations, determine the profitability of investing in cow cooling measures. You don’t need to be an expert to do this.
How can you find the telltale signs of heat stress in your records? A few of the key areas include reduced milk production; butterfat depression; declines in reproductive performance; more clinical and subclinical mastitis; and elevated morbidity in transition cows.
In this fact sheet, we will give you sample commands and examples of the resulting data you can use to unlock the power of your herd’s DairyComp records.
Milk Production
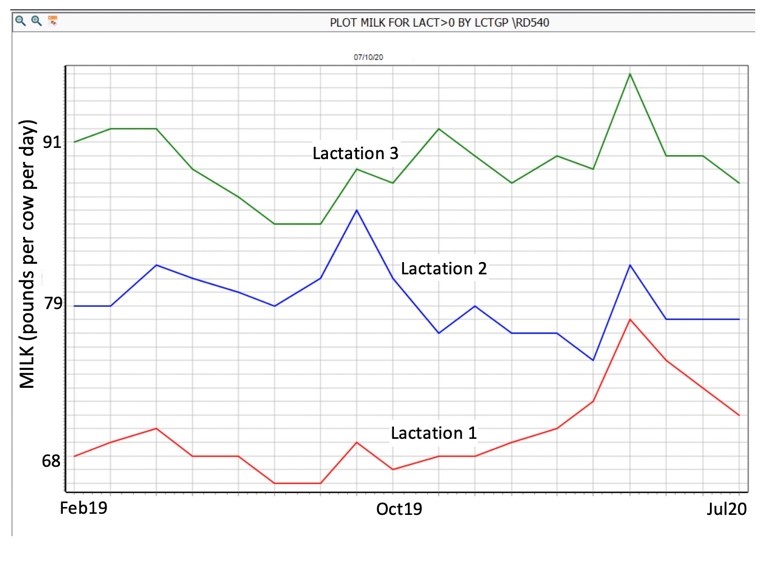
Figure 1 shows average daily milk production on a per cow basis for first, second, and third lactation cows over the last 18 months. As you can see, production in this herd starts a seasonal decline in June that slumps to lows in July and August for all lactation groups. The herd has 921 lactating cows that average 80 pounds of milk per cow per day in the nonsummer months. The herd’s average production for June, July, and August is 78 pounds per cow per day.
Figure 1: The command behind this graph: PLOT MILK FOR LACT>0 BY LCTGP\RD540
Butterfat Percent
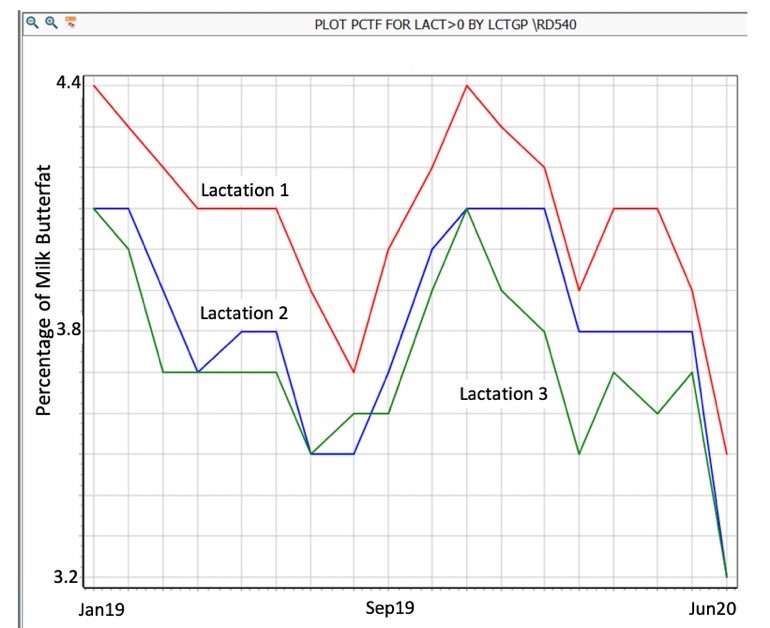
Figure 2 plots average percent butterfat on a per cow basis over the last 18 months. For this herd of 921 cows, the average butterfat for nonsummer months is 3.96%. However, in June, July, and August, butterfat percentage for the herd falls to 3.6%.
Figure 2: The command behind this graph: PLOT PCTF FOR LACT>0 BY LCTGP\RD540
Reproduction
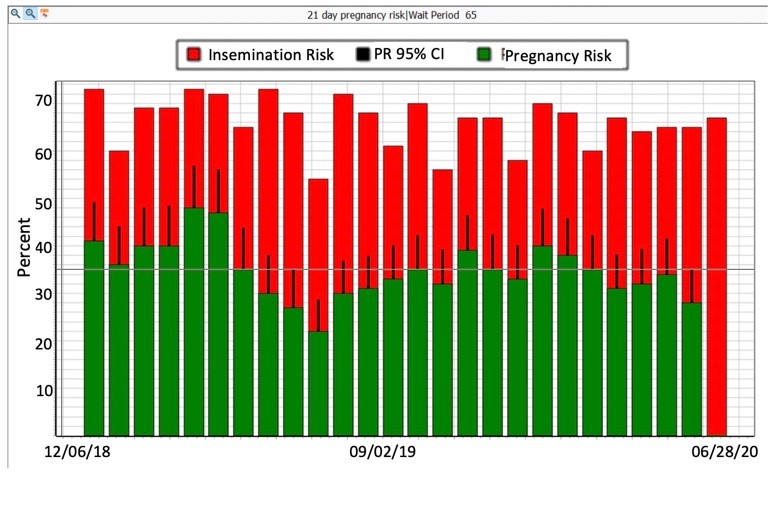
The command in Figure 3 creates a graph showing the insemination risk in red and the pregnancy risk in blue over an 18-month period. The herd maintains a 36% 21-day pregnancy rate during the nonsummer months. This drops to 27.5% in June, July, and August.
Figure 3. The command behind this graph: BREDSUM\EV65
Milk Quality
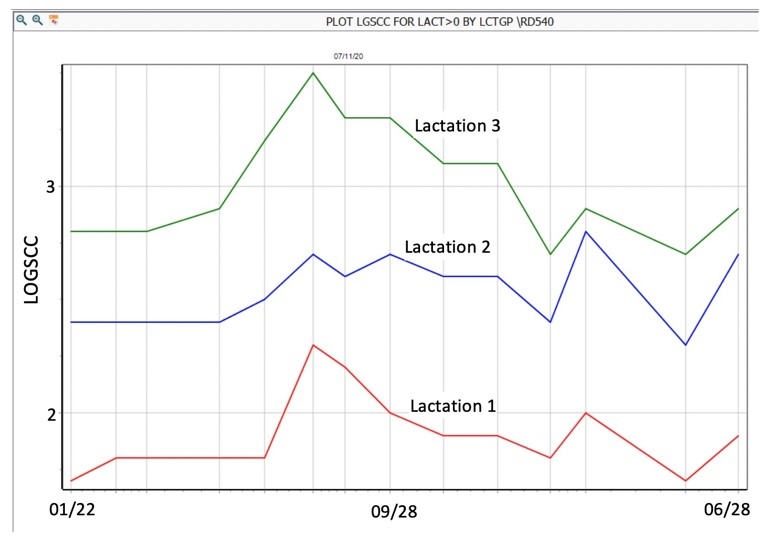
Figure 4 shows somatic cell count (SCC) log/linear score (LGSCC) trends over time. LGSCC converts somatic cell count to a log/linear score. For example, a LGSCC of 4 correlates to 200,000 cells per milliliter (cells/mL) SCC. There is a direct correlation between LGSCC with udder health and milk loss. In Figure 4, LGSCC elevates from a nonsummer average of 2.3 to an average of 2.7 for June, July, and August.
One physiological by-product of heat stress in dairy cows is reduced immune function that can lead to higher SCC as observed in this herd. Also, it is not uncommon to notice a lag between when heat stress occurs and when SCC becomes elevated.
Figure 4. The command behind this graph: PLOT LGSCC FOR LACT>0 BY LCTGP\RD540
Clinical Mastitis and Transition Cow Health
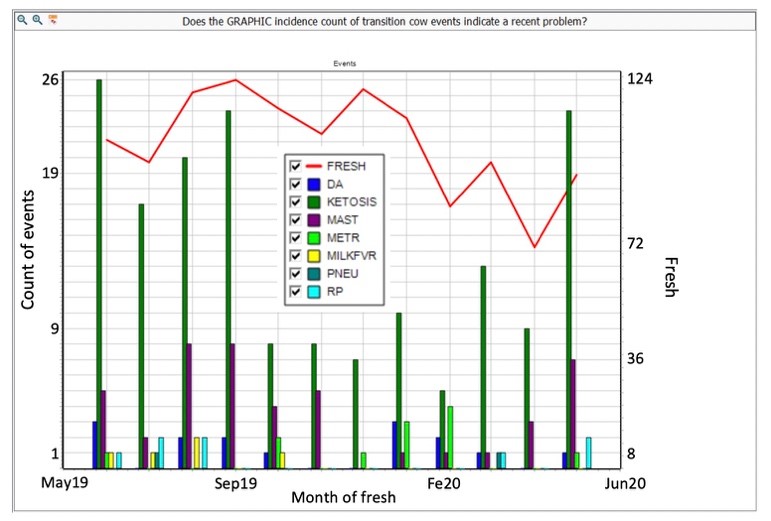
Figure 5 provides a visual picture of health events during the critical transition cow period over the last year. In this herd, there are three clinical mastitis cases per month on average, but from June through September, cases double to six per month. Clinical ketosis also shows the same seasonal trend, elevating from an average of 10 cases to 21 per month during the summer.
Figure 5. The command behind this graph: EGRAPH FRESH DA KETOSIS MAST METR MILKFVR PNEU RP FOR LACT>0 DIM<31 \FN1
Determine the Economic Losses
Impacts of heat stress during the summer months (90 days) for the example herd of 921 cows can be translated to the following economic losses:
- Assuming a marginal milk production of 2.4 pounds per pound of feed, the loss is 11 cents per pound of milk not produced (at 16 cents per pound of milk and 12 cents per pound of feed). A loss of 2 pounds per cow per day equals losses of $0.22 per cow per day. For our sample herd, the value lost during summer is 921 x 90 x $0.22 = $18,236.
- Considering a price of $2.68 per pound of fat, 0.36% milkfat depression represents a reduced milk price of $0.964 per hundredweight (cwt.) due to heat stress. For the milk quantity side of the equation, multiply the herd’s summer production of 78 pounds per cow x 921 cows x 90 days/100 = 64,650 cwt. of milk produced in summer. To get the total loss resulting from milkfat depression, multiply summer production by the reduction in milk price. For this herd, the calculation is 64,650 cwt. x 0.964 per cwt. = $62,323.
- A drop in pregnancy rate from 36% to 27.5% represents a loss of $18.23 per cow during summer months (https://dairymgt.info: Dairy Reproductive Economic Analysis). The impact of reduced herd reproductive performance is determined by multiplying 921 x $18.23 = $16,790.
- A rise of LGSCC from 2.3 to 2.7 equates to approximately 20.9 pounds per cow of less production or $2.30 in losses per cow during summer. For this herd, lost revenue due to increased SCC is calculated by multiplying 921 x $2.30 = $2,118.
- Considering each case of clinical mastitis at a cost of $286, 9 more cases during summer account for losses of $2,574.
- Considering each case of ketosis at a cost of $129; 33 more cases during summer equals to losses of $4,257.

Summary
Heat stress causes losses that cost the U.S. dairy industry an estimated $1.5 billion annually. For the farm analyzed in this article, losses due to heat stress totaled $106,298. Knowing this information allows the producer to invest in appropriate heat stress mitigation measures that can contribute directly to the dairy’s bottom line.
Table of Commands:
| Problem | DairyComp Command |
|---|---|
|
Reduced milk production |
PLOT MILK FOR LACT>0 BY LCTGP\RD540 |
|
Butterfat depression |
PLOT PCTF FOR LACT>0 BY LCTGP\RD540 |
|
Declines in reproduction performance |
BREDSUM\EV65 |
|
Increases in clinical and sub-clinical mastitis |
PLOT LGSCC FOR LACT>0 BY LCTGP\RD540 |
|
Increased morbidity in transition cows |
EGRAPH FRESH DA KETOSIS MAST METR MILKFVR PNEU RP FOR LACT>0 DIM<31 \FN1 |


