Build a SUM Report
A SUM report generates averages for specific items or animals within certain groups and presents details in a table or graph
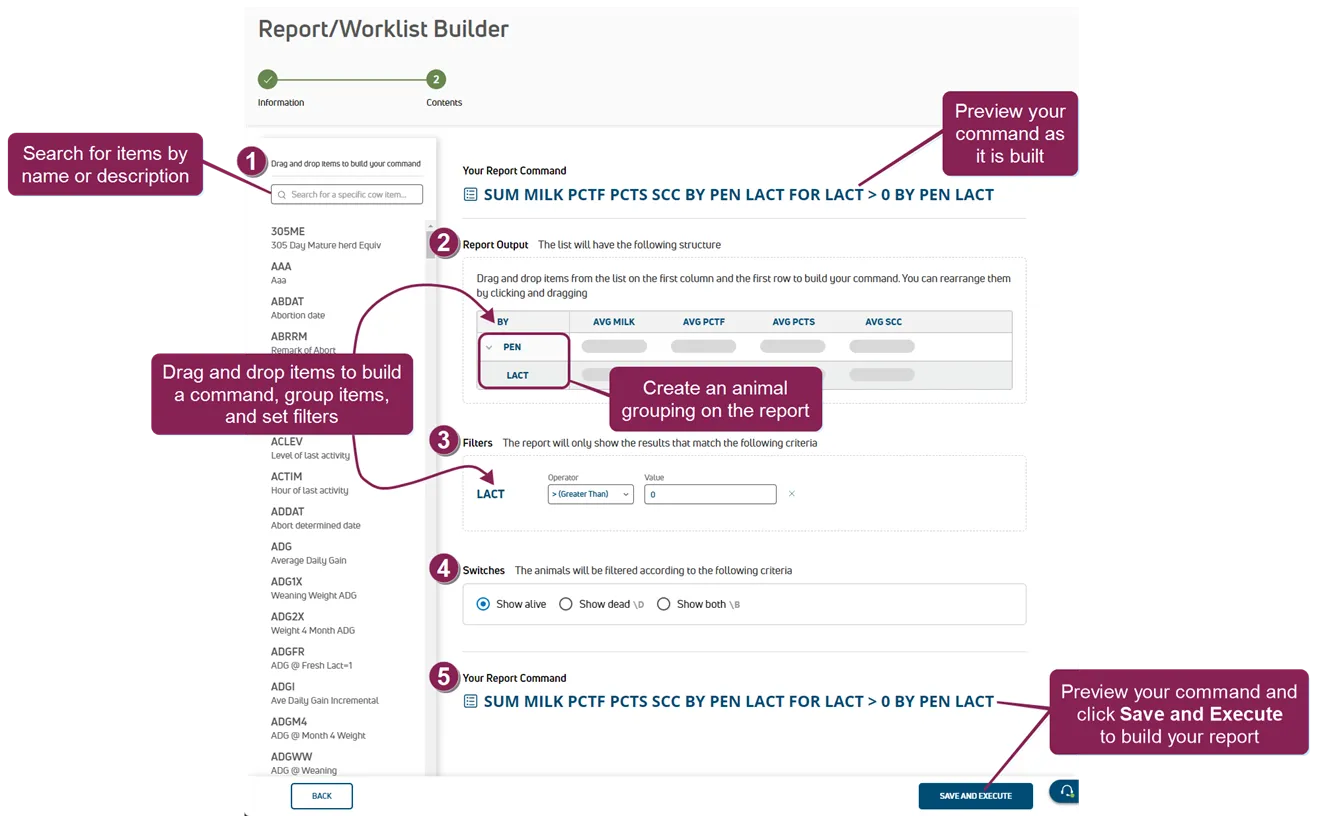
Follow the steps below to continue:
Use the search field at the top of the items list to find items by name or description. For example, searching for "sire" finds all associated items in your dairy: LSIR, MGSIR, PSIRC, SIR1, etc. See the Build a LIST ReportBuild a LIST Report topic to learn more about using search.
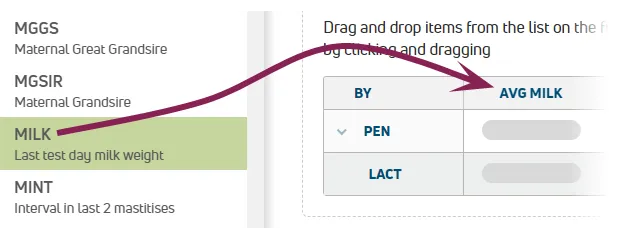
To build your report, drag and drop items from the items list onto the Report Output area. Reorder the columns by dragging and dropping the item names  or click the x next to an item name to delete it. See the Build a LIST ReportBuild a LIST Report topic to learn more about reordering and deleting columns.
The SUM report automatically adds "AVG" to the item name when an item is dragged and dropped from the items list into the column header on the right side of the Report Output area.
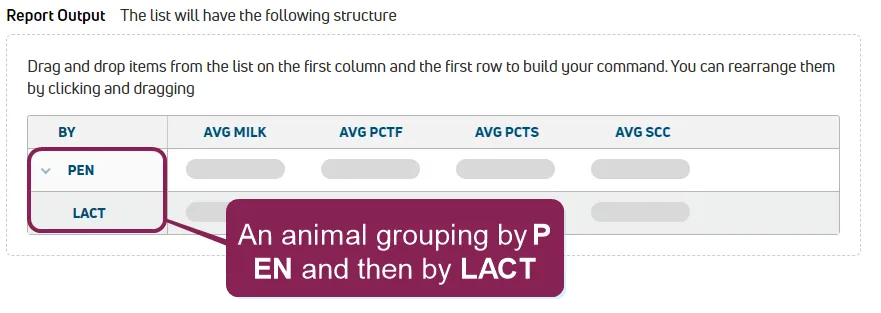
The SUM report also allows you to control how some animals are grouped by dragging and dropping items from the items list into a row beneath the BY column on the left side of the Report Output area. The first item dropped will become the first grouping on the report.
For example, if you drag and drop the PEN item and then drag and drop the LACT item beneath it, an animal grouping is created by pen and then by lactation.
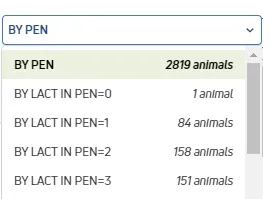
When the report is run, the results are grouped first by pen and then by lactation.
To set filters, drag and drop items from the items list into the Filters area, and then choose an Operator from the drop-down and set a Value for the operator. See the Build a LIST ReportBuild a LIST Report topic to learn more about using filters.
In the Switches area, select to include alive, dead, or all animals in your report.
The SUM report also allows you to control how some calculations are handled by checking one or both of the following boxes:
- Include zero values in averages and standard deviation calculations. Without the switch, average, standard deviation, mode, and median PULSE calculations include non-zero values only.
- Use sample values for standard deviation calculation. Without the switch, PULSE calculates population standard deviation.
Click Save and Execute to build your report and display the results of the report on the See Reports/Worklists Results page. DC Unlimited subscribers can also preview the command as the report is being built.