Viewing Graphs and Plots
2 min
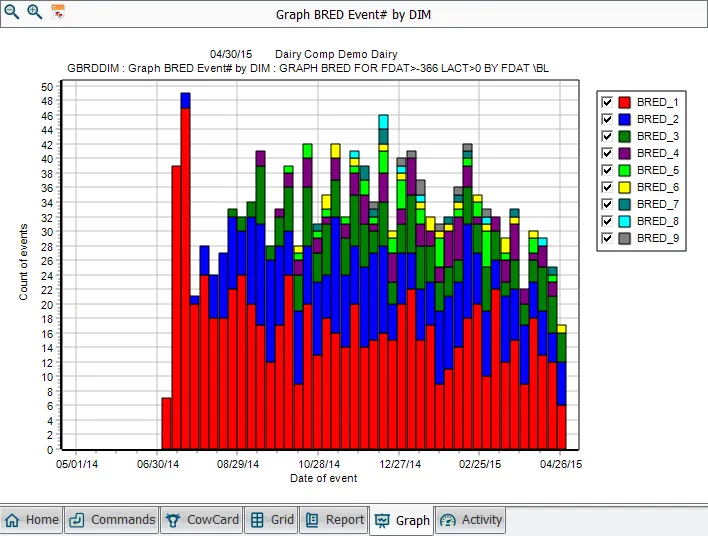
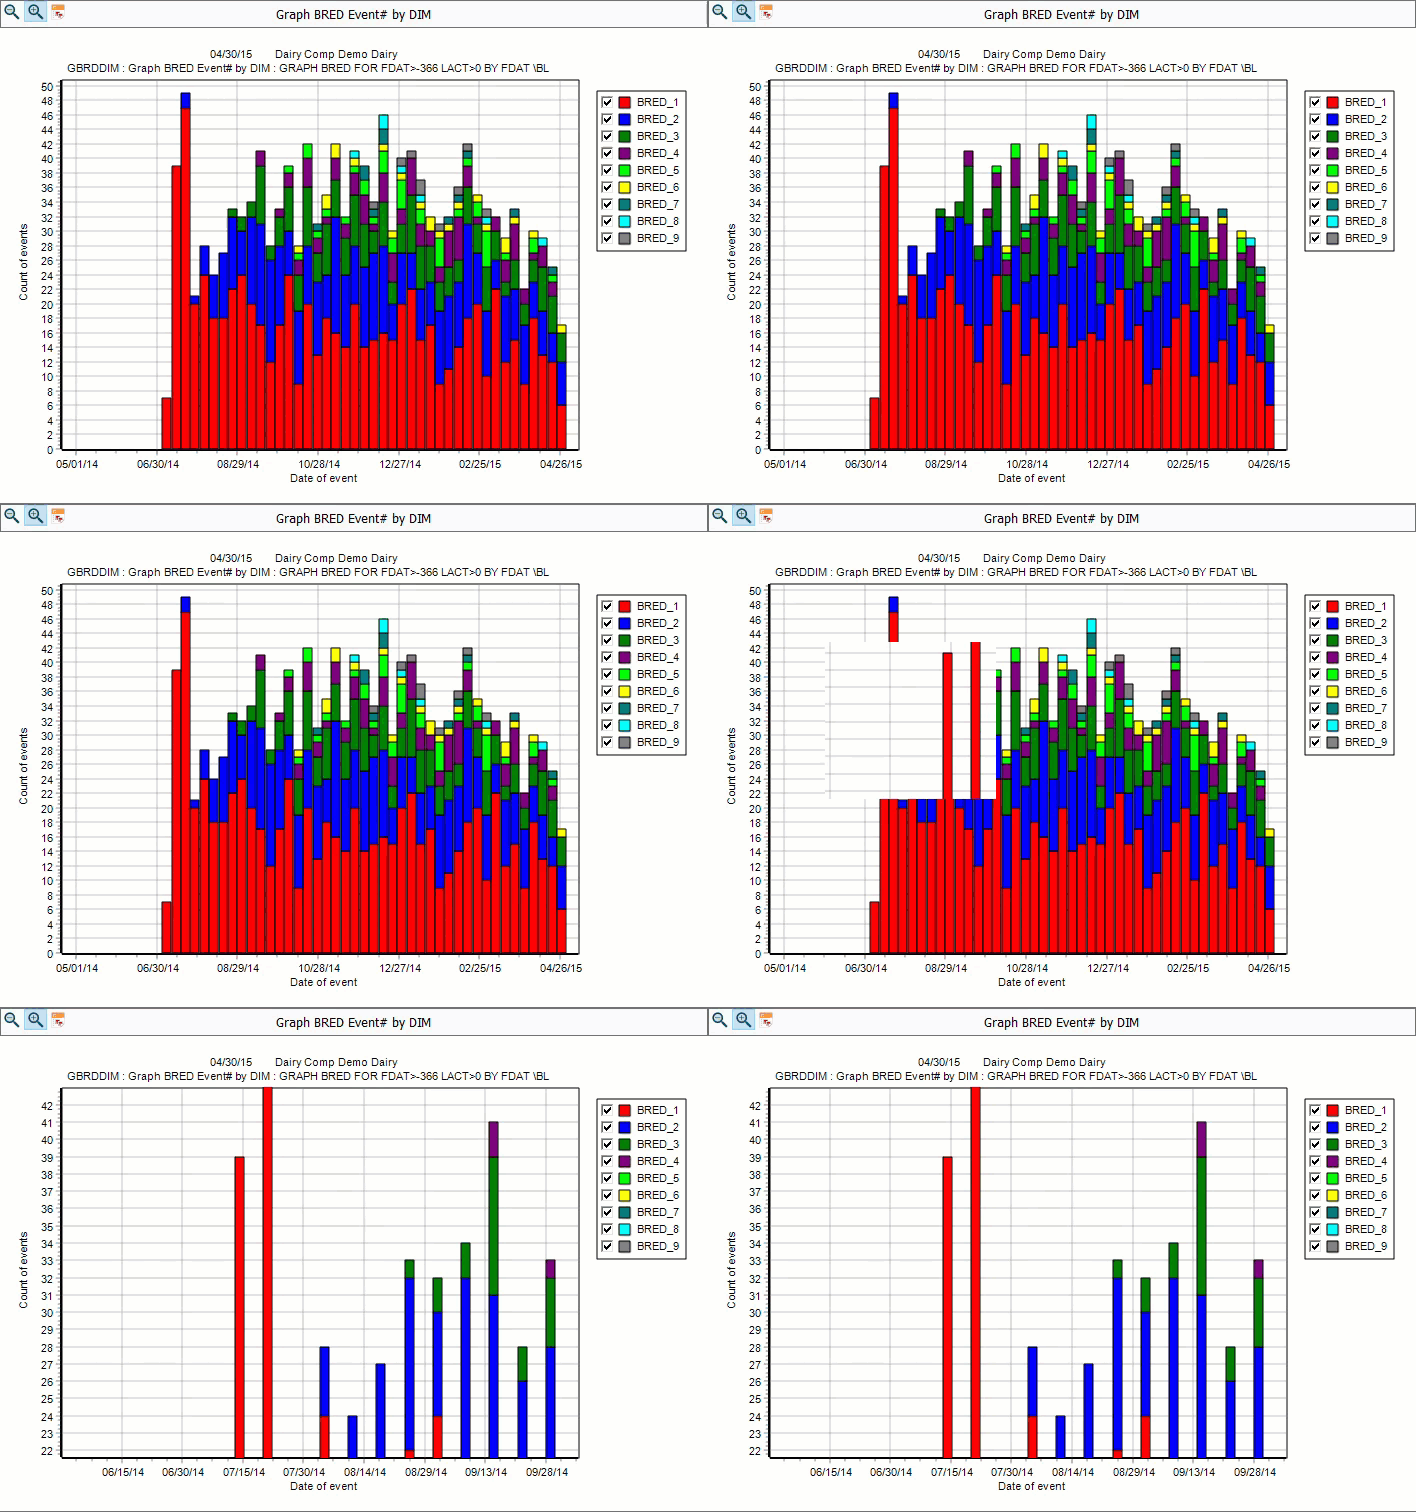
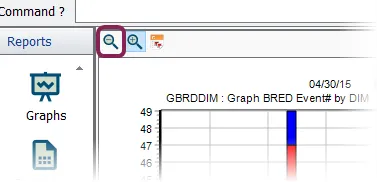
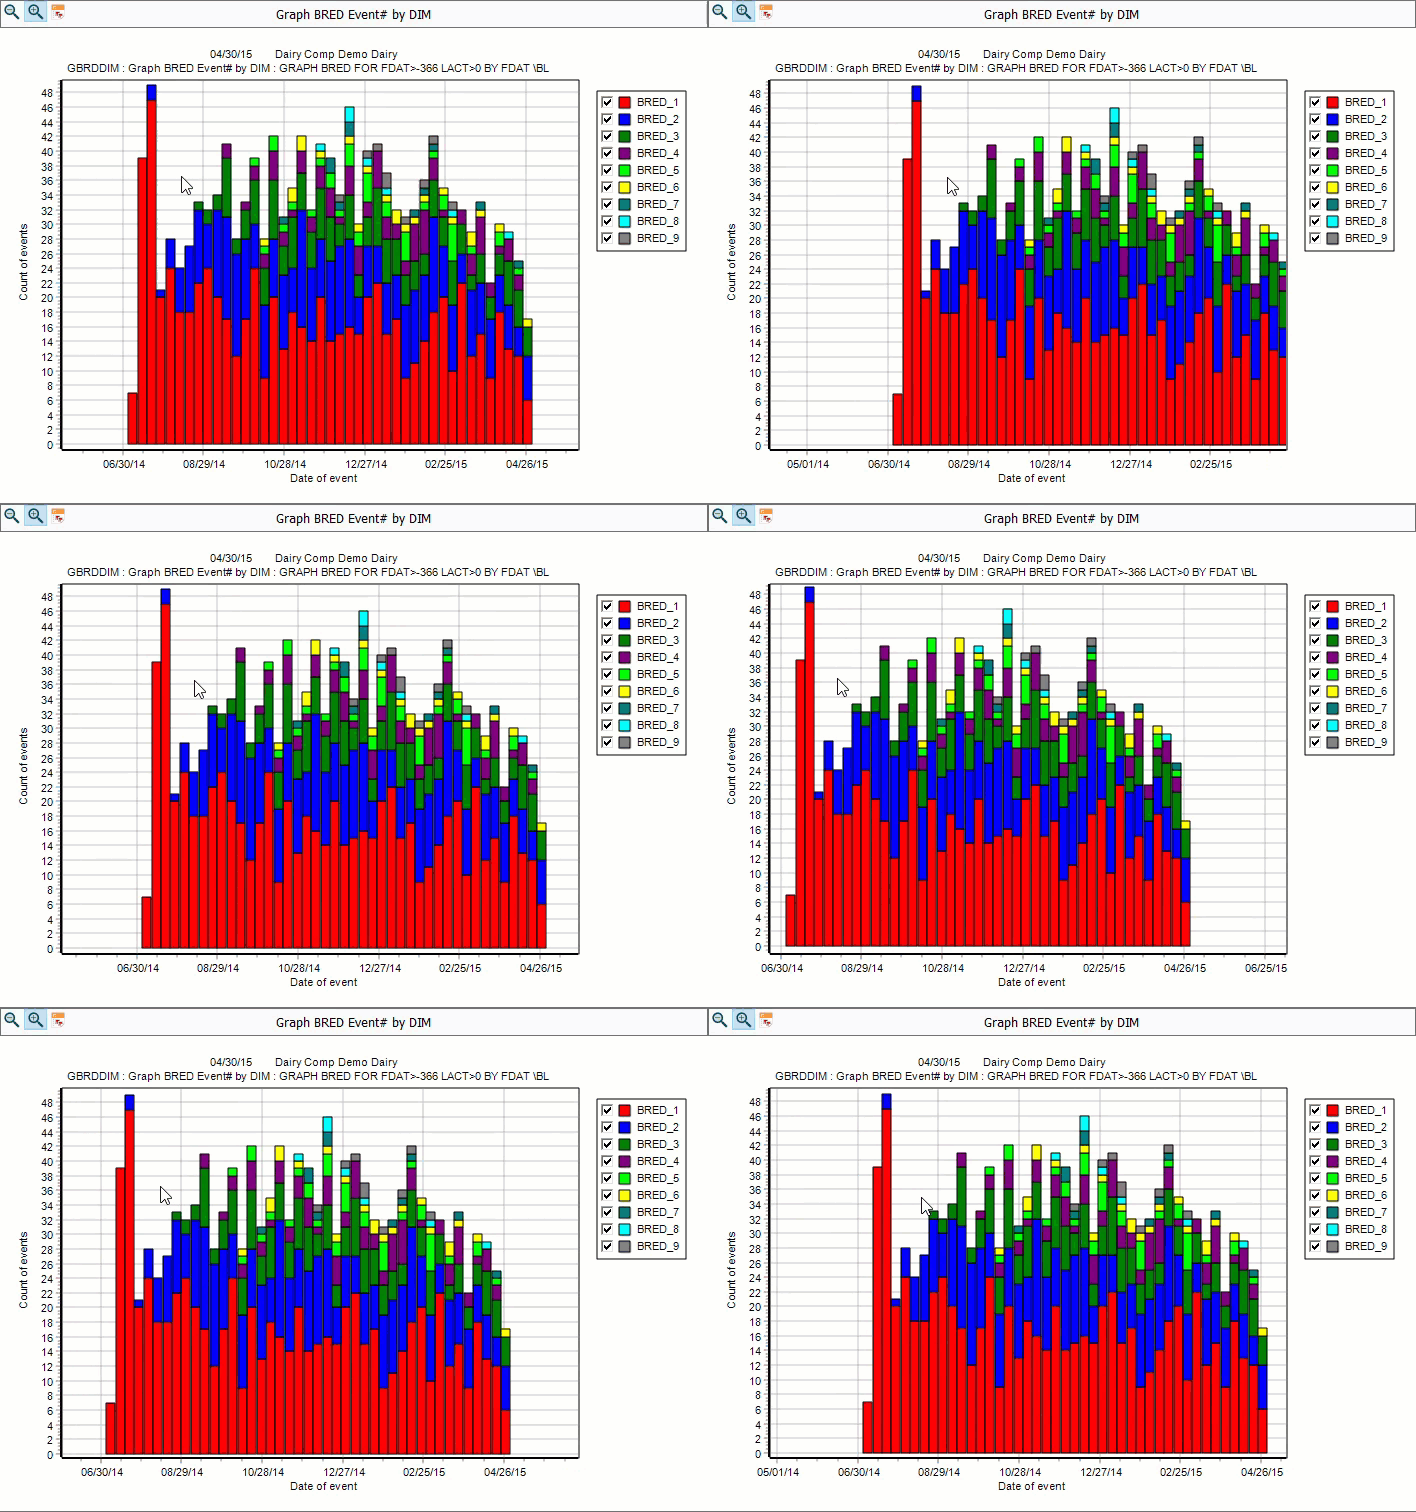
results from an executed graph or plot command are compiled on the graph page from this page, you can print the results graph adjust the view zoom in and out slide the graph in any direction to shift the viewing area expand the topics below to learn more about performing these various actions print you can print the contents of most pages by clicking the print button on the toolbar or selecting print from the file menu charts and graphs always print in graphic mode and in color if your printer supports it zoom in/out to zoom into a selected area on the graph, hold down the left mouse button and drag the box that displays from the upper left to the lower right of the area you wish to enhance you can restore a graph to its original view by clicking the undo zoom drag graphs and plots to shift the graph viewing area without zooming in, hold down the right mouse button and drag the cursor around you can restore a graph to its original view by clicking the undo zoom related topics visualize event distribution with egraph docid\ wz70pt9vc4zc9r0pbk2dm visualize item distribution with graph docid\ rhzbb3lboeiok rljsku8 visualize historical measurements with eplot docid\ lceecsltprza9pf tuon8