Summary of Commands
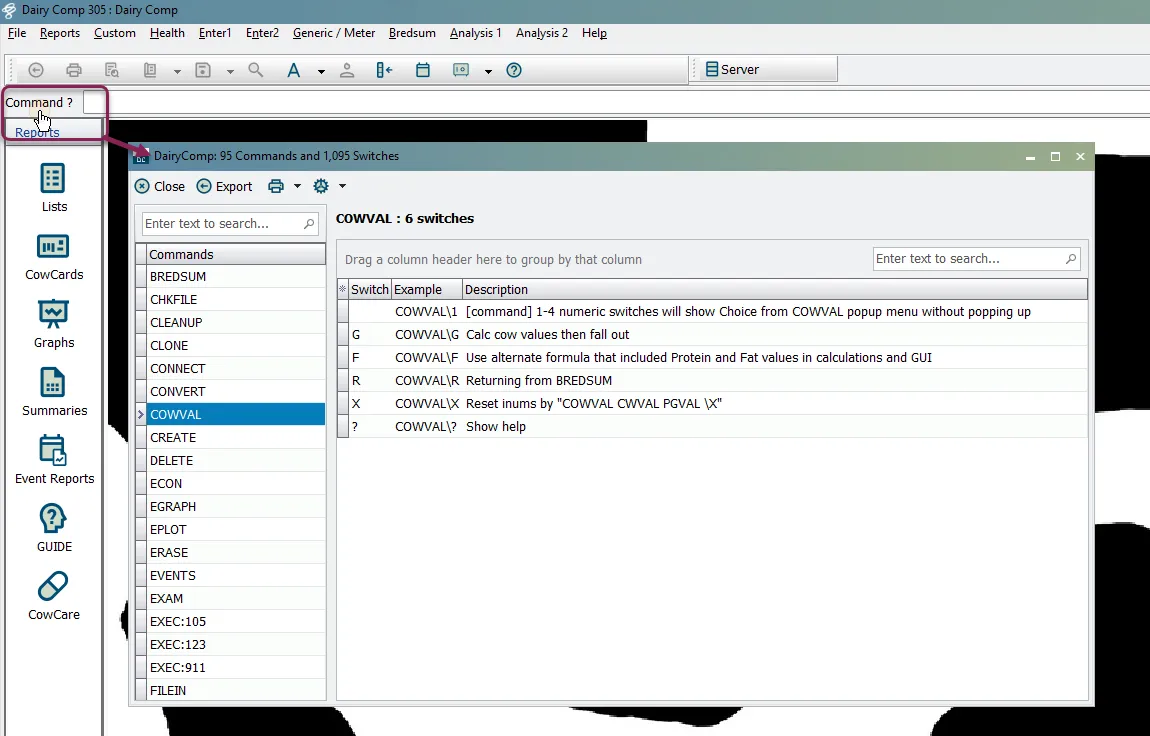
See the information below to view a summary of commands available in DairyComp:
&#xNAN;ALTER | Configuration module or all customizations of items, commands, pens, events, and so on. |
|---|---|
BREDSUM | Used to examine the effectiveness of a breeding program. Switches include the following:\T = By Technician\O = By Breeding Code\B = By Number of Times Bred\I = Interval Analysis\N = By Cycle Number\E = 21 Day Heat Trial\Y = Include Heifers\V# = Voluntary Waiting Period\U = Bullpen Preg Rates\UR = Bullpen by 21 Days\A = Assume All Breedings\D or \D# = Select Date Range\X = Cross Measure 2 Variables |
&#xNAN;CHKFILE | Utility to search for animal IDs, show available ID numbers, or fix corrupted animal records. |
&#xNAN;COWVAL | Estimate an animal's value within the herd relative to an average fresh heifer. Also calculates the animal's pregnancy value. |
&#xNAN;ECON | Utility used to calculate economic factors. Switches include the following:\E = Lists of animals with certain events within a certain time frame\I or \IR (\R with cull rate) = Calf summary table for last 365 days by month\ID = Table of all events for last 365 days by month\S = Table of all events for last 365 days by DIM |
EGRAPH | Graph of data from events. Can be done by calendar date, DIM for animals, or AGE for heifers. Can also graph remarks of the event instead of count of events. |
&#xNAN;EPLOT | Used to graph body scores, height and weight measurements. |
EVENTS | Used to view a list or table of events for different time periods and parameters. Switches include the following:\2SI = Lists of animals with certain events within a certain time frame\3 = Calf summary table for last 365 days by month\5 = Table of all events for last 365 days by month\6 = Table of all events for last 365 days by DIM\7 = Table of all events for last 365 days by month of fresh |
&#xNAN;FILEOUT | Used to export data items to CSV or TXT files. |
GRAPH | Used to graph one item by itself (histogram) or multiple against each other (scatter graph). |
LIST /SHOW | Used to create a listing of animals with certain items and conditions, within a specified sorting order. |
&#xNAN;MONITOR | Procedure that lets you define, calculate, and report a group of herd management statistics. Typically run at the beginning of the month. |
&#xNAN;PCT | Percent command is used to calculate the number of animals in the first condition that meet the conditions for the second list. |
&#xNAN;PLOT | Used to graph test day information by test date or by DIM. |
SIRES | Used to look at or generate reports on the latest sire NAAB production and type proofs. |
SUM | Used to get averages for certain items or number of animals within certain groups. |