CowCare Statistics
CowCare automatically opens to the Stats screen, which includes three main sections to help you manage your drug inventory, track drug usage, and evaluate animals that have been on the highest number of treatment protocols.
NOTE: This topic is based on the latest version of CowCare. Existing DairyComp customers can enable the new CowCare by going to SETUP > Preferences and clicking the Turn on New CowCare button.
Expand the topics below to learn more about using the Stats screen:
The Treatment Drug Requirements section shows you which drugs are needed for drug treatments that are not yet approved. The table on the left lists each drug, the quantity in inventory, the number of treatments that are open, and the quantity needed. Drugs highlighted in red indicate low inventory. The pie chart on the right is a visual of the information listed in the table.
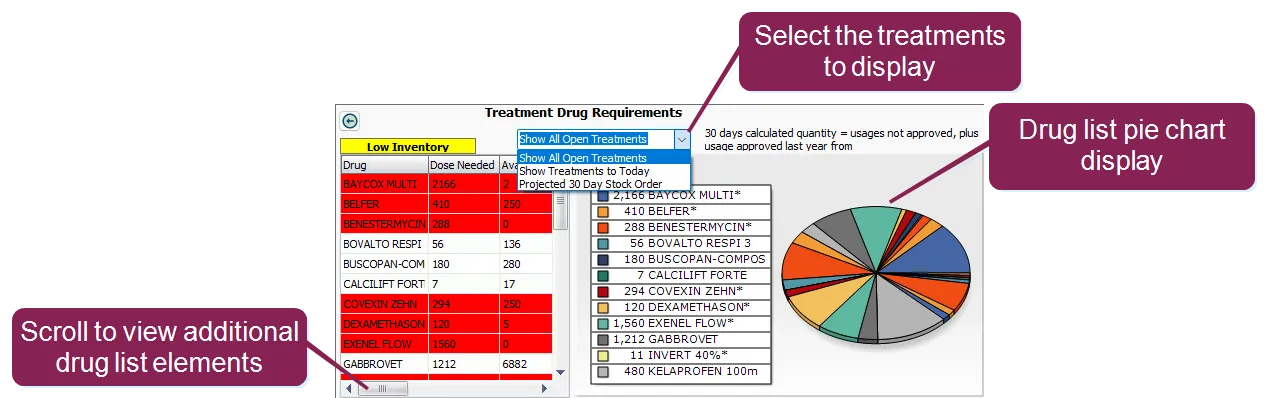
Select one of the following options from the drop-down list at the top of the screen:
- Show All Open Treatments: Includes all prescribed protocol treatments.
- Show Treatments to Today: Includes protocol treatments for today.
- Projected 30 Day Stock Order: Forecasts drugs needed for the next 30 days.
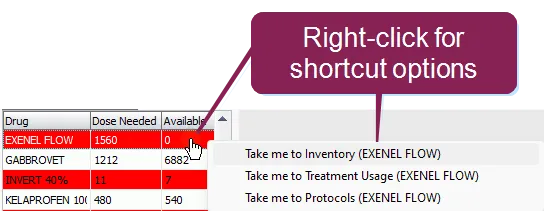
Right-click the table or chart for shortcuts to other CowCare screens.
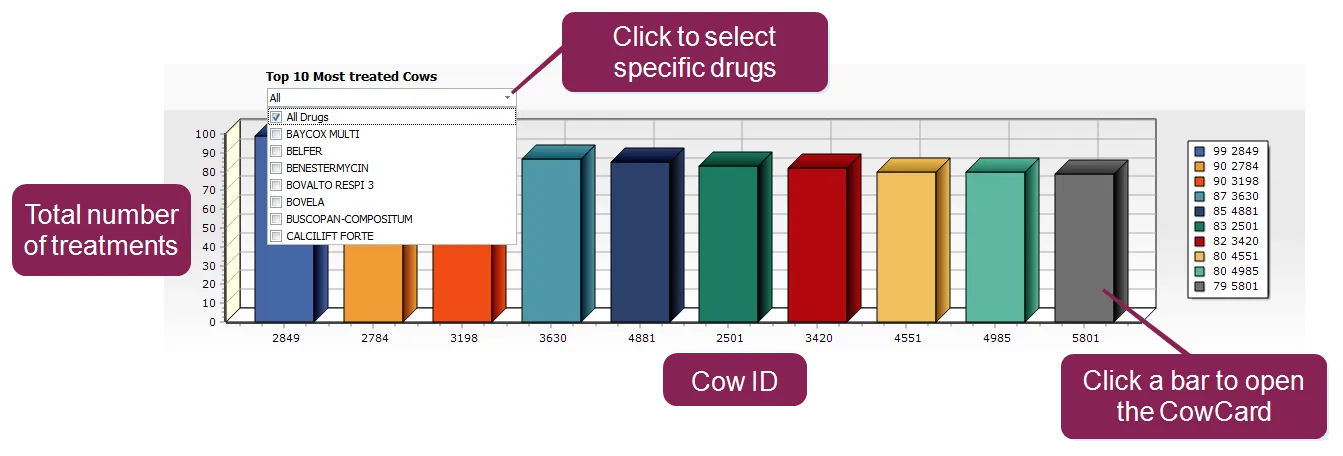
The Top 10 Most Treated Cows bar identifies 10 animals with the highest number of treatments. This information may be helpful in culling decisions or to identify potential areas for improvement in your dairy operations.
By default, all drugs are selected. Use the drop-down to select one or more drugs. You can click on a bar to open that animal's CowCard.
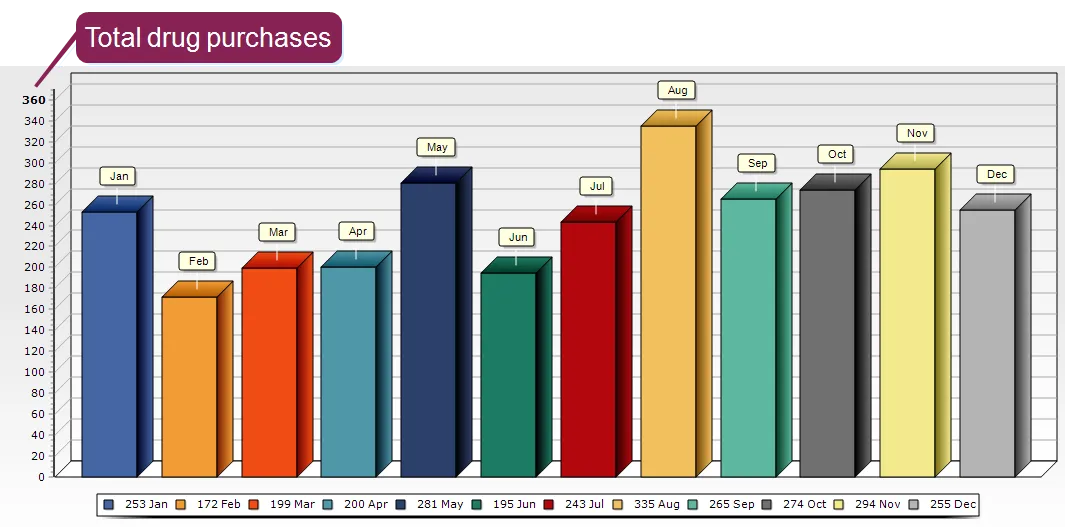
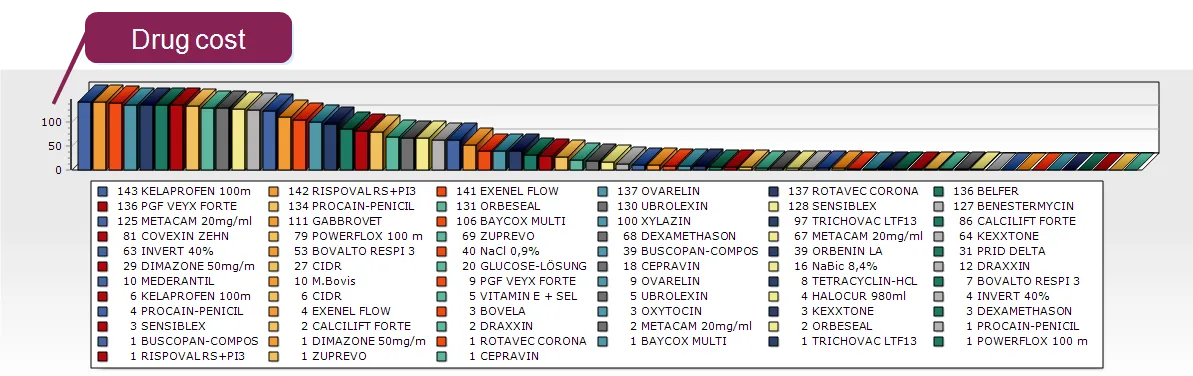
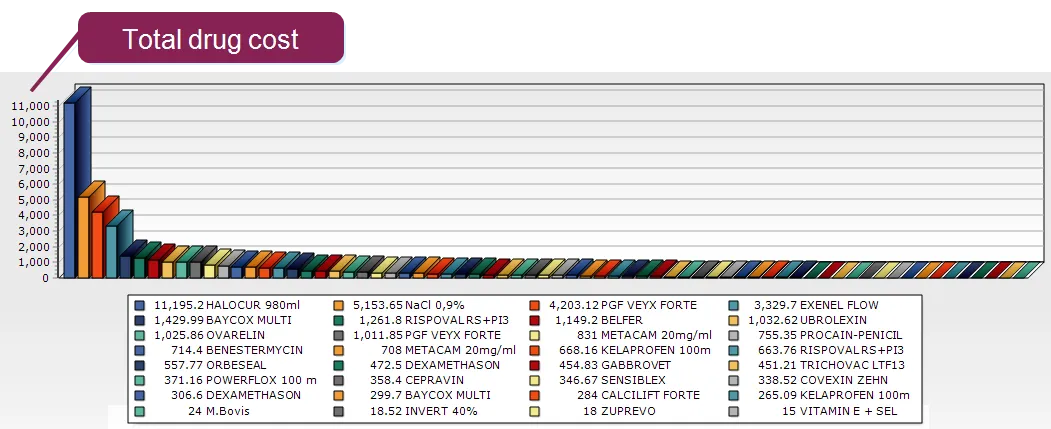
The Total Treatment Usage bar chart provides various views of your dairy's drug usage. You can select between six different reports and five varying time spans.
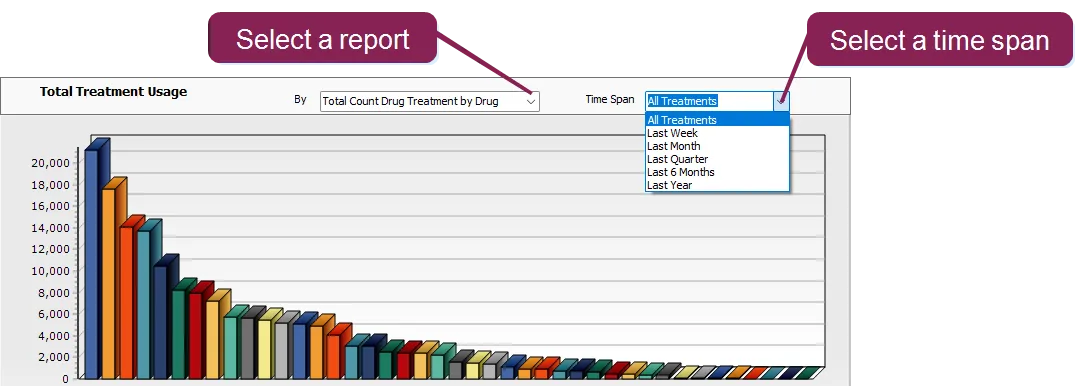
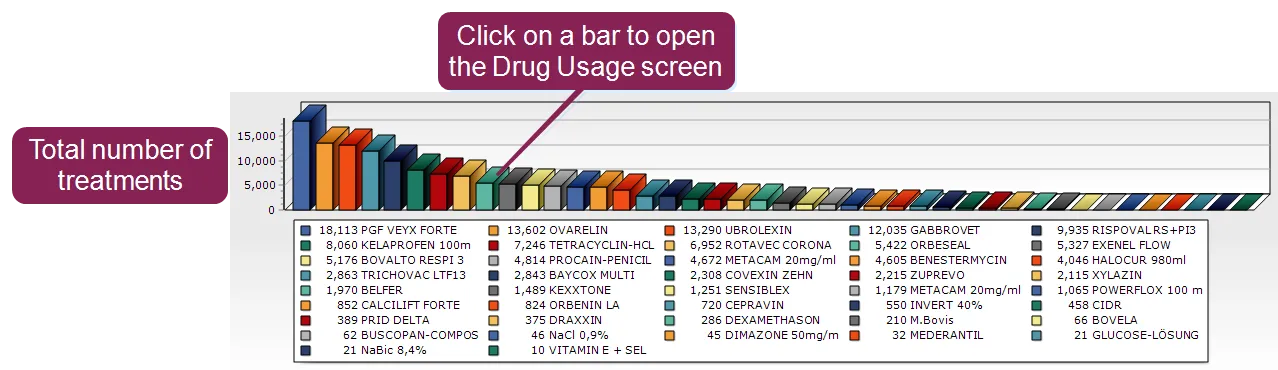
- Total Count Drug Treatment by Drug: Shows the total number of times a drug has been used during the selected time frame. You can click on drug bar to view that drug in the Drug UsageDrug Usage screen.
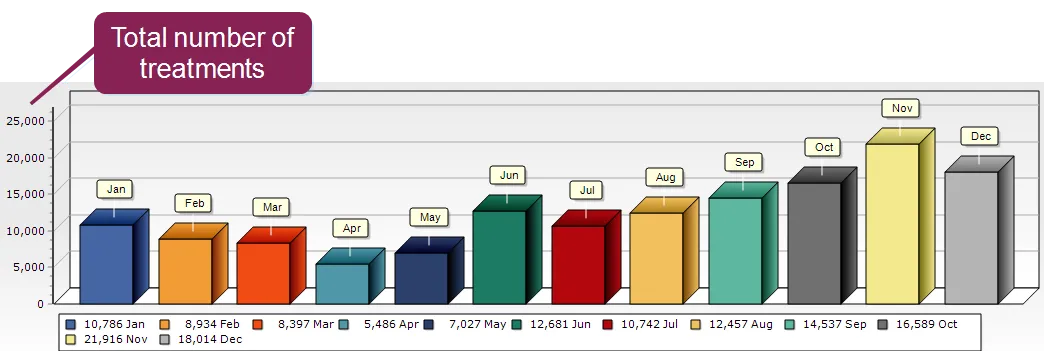
- Total Count Drug Treatment by Month: Shows the total number of times a drug was used over the selected time period by month.
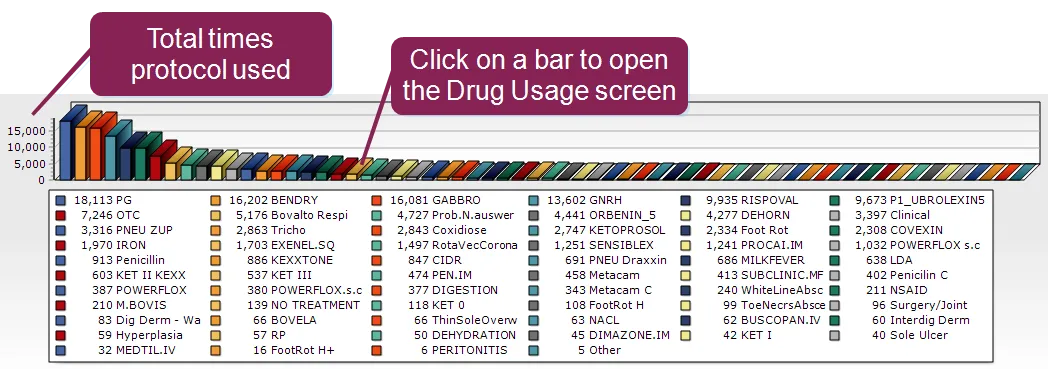
- Total Count Protocol Treatment by Protocol: Shows the total number of times a protocol was used in the selected time period by protocol. You can click on drug bar to view that drug in the Drug UsageDrug Usage screen.
- Total Count Drug Cost: Shows the amount of times a drug was used by drug cost.
- Total Amount Drug Cost: Shows the total cost of drugs over the selected time period.
- Total Count Purchases by Month: Shows the total purchases of all drugs by month during the selected time period.