View Daily Milk Graphs
For herds with a meter configured for daily milk readings, clicking the DMGraph icon  displays the feature-loaded DMGraph window.
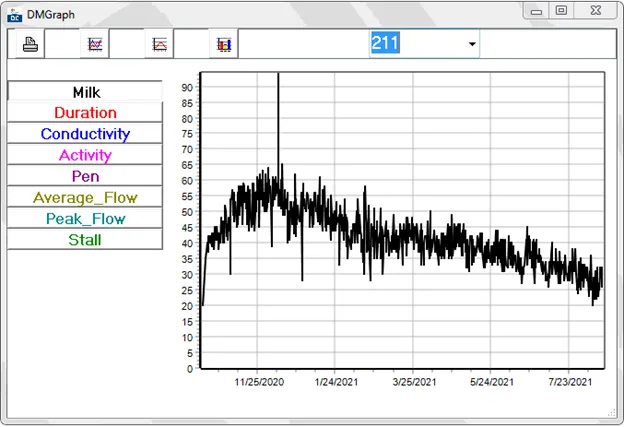
When the window opens, the Milk option is selected by default and represented by a black graph. If you simply select another option, you'll notice the two graphs display simultaneously along the same axes.
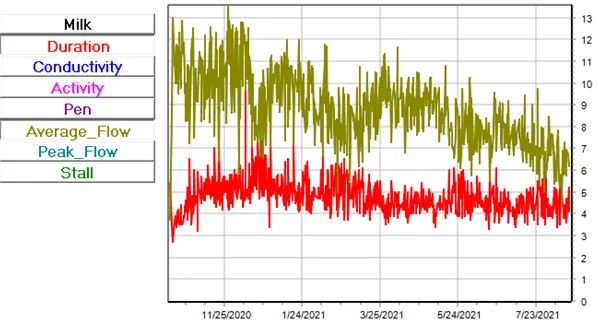
To change the data shown and only show one graph, click the current option to deselect it in the Daily Milk graph then click the new option to display.
Use the table below for a brief overview of what each of the options at the top of the window does:
DMGraph Icon | Icon Name | Description |
|---|---|---|
 | Prints the displayed graph. | |
 | Toggle Points/Line | Displays the graph as a line or as individual data points. |
 | Toggle Smooth/Raw | Displays the graph as a line of averages ("smooth") or point-by-point ("raw"). |
 | Toggle Totals/Milking | Displays the animal's total milking amount within a 24-hour time frame or the individual milkings that comprise each total. |
 | CowCard Selection drop-down | Changes which animal displays on the Daily Milk graph. |