Activity Logs
4 min
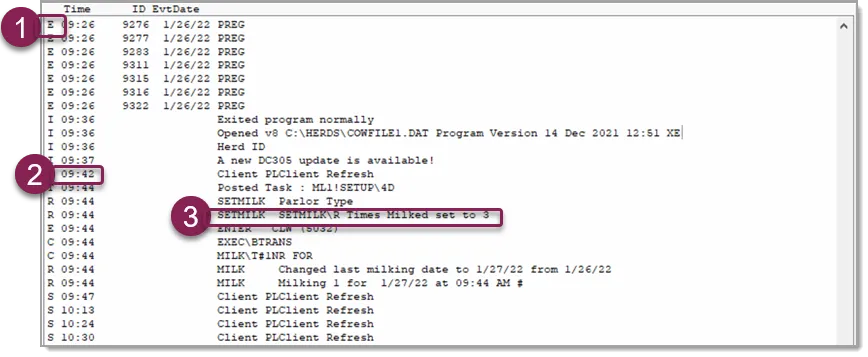
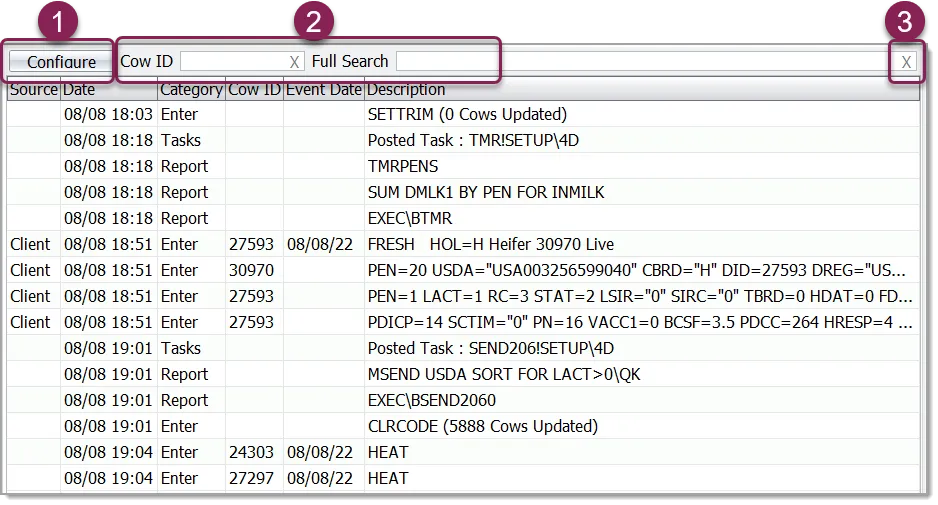
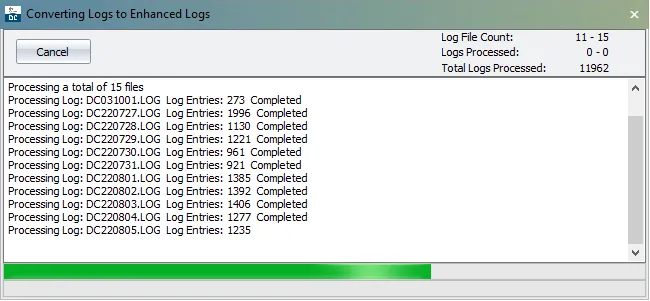
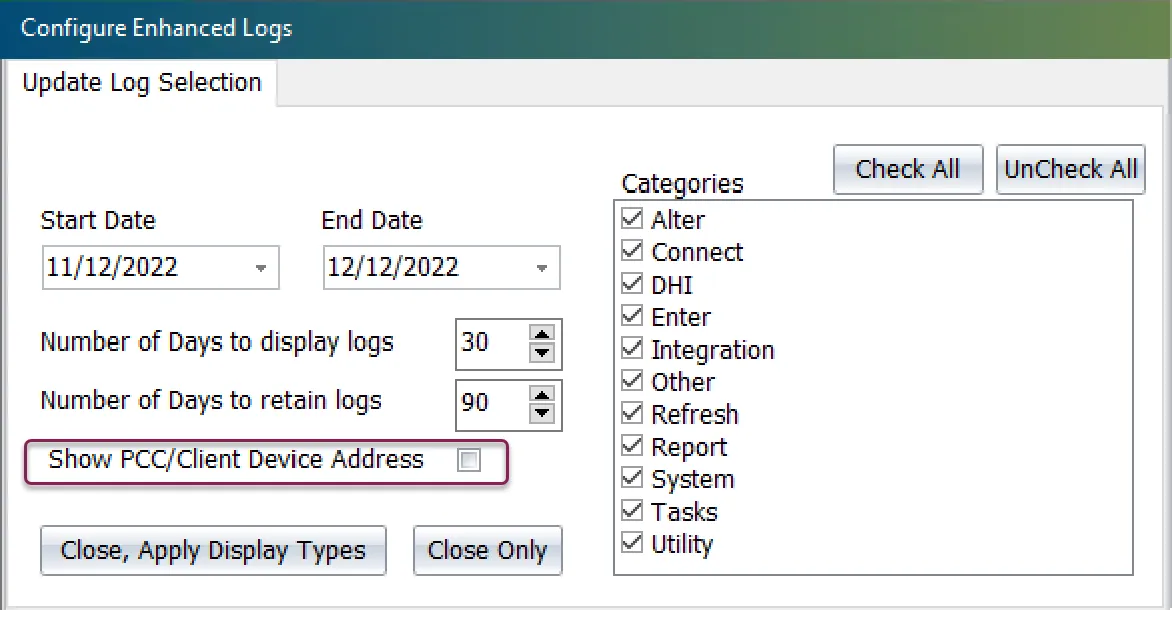
dairycomp tracks all data entry activity from your computer, pulse, and mobile devices to keep tabs on the latest animal updates and changes made you can choose to view the standard activity log, or enable enhanced logging for additional options and more information standard activity logs are the default in dairycomp the standard activity log displays only the character tag, event time, id, date, and activity information the standard activity log does not include any enhanced configuration options the enhanced activity log presents a cleaner and easier to read display of entries and activities generated by dairycomp the enhanced activity log also uses categories docid\ stccjtezhsrgpxyxsgqag for activities that can optionally be used to limit or select which activity log data is displayed both activity logs can be accessed from the activity tab on the bottom of the dairycomp window examples of each activity log are displayed below standard activity log \<font color="#882255">1\</font> character tag \<font color="#882255">2\</font> timestamp \<font color="#882255">3\</font> task command enhanced activity log \<font color="#882255">1\</font> click to open log display options \<font color="#882255">2\</font> search by cow id or by keyword using full search \<font color="#882255">3\</font> click to clear the search and display the default logs expand the topics below to learn more guidelines for using standard activity logs all standard activity log entries have a single character tag \<font color="#67854e">c\</font> reports \<font color="#67854e">d\</font> client \<font color="#67854e">e\</font> \<font color="#67854e"> or v\</font> local entry \<font color="#67854e">i or s \</font> system messages (such as logon) \<font color="#67854e">m\</font> \<font color="#67854e">n\</font> itrans \<font color="#67854e">p\</font> pulse \<font color="#67854e">r\</font> various command summary results (such as a milk import) \<font color="#67854e">t\</font> task, followed by the task command \<font color="#67854e">v\</font> incoming transactions the time field is displayed as hh\ mm for local data entries, the id is displayed after the time field guidelines for using enhanced activity logs when enhanced activity logs are enabled, activities and entries are grouped into categories you can then view activities and entries by category or date, or hide categories from the log enable enhanced activity logs to enable this feature, enter the setup command in the command line and go to the preferences tab toggle on enhanced logging there are two enhanced logging options, one to enable and another to disable, as needed as the logs are converted, the following window displays note enabling logs typically takes less than one or two minutes however, it may take up to 15 minutes for large herds where multiple activities need to be processed configure enhanced activity logs click the configure button to open the configure enhanced logs window these options allow you to control the activities that are displayed in the logs to display the device address in the activity log, check the box next to show /client device address a common configuration option is to select the categories to list for example, client refreshes can clutter up the logs so you may not want them displayed it is also useful, especially for diagnosing an issue, to list just one category as an example, if you wanted to see if tasks are running properly, you could select tasks only in another example, you can review the status and timing of milk loads by only selecting integrations the configure enhanced logs window also allows a date range to be selected, along with the number of days to display in the log page note depending on the size of the herd, setting the date range to more than 7 days to display may slow overall performance use the show /client device address option to display the device address in the activity log all logging still occurs as these filter settings only affect what is displayed when selections are limited, the “log listing contains filtered types” message, indicating that not all activities are displayed enhanced activity log columns the following are the default activity log columns \<font color="#f3f4f6">column\</font> \<font color="#f3f4f6">meaning\</font> source point of entry, such as a client, , or pulse future enhancements include additional details to the source field date date and time of entry category each entry is assigned a category, which allows limiting the display to include or exclude categories cow id id or barn name for entries, you can select a specific animal in the "cow id" entry field event date date of event, if applicable description this field can vary between the command/report used, description, or a task that ran enhanced activity log categories all log entries are assigned a category which can be used for selection the current default categories include \<font color="#f3f4f6">column\</font> \<font color="#f3f4f6">meaning\</font> alter changes made in alter to items, commands, etc connect uploads, downloads, and backups dhi send and receive items for test day actions enter event and items entries integration milk loads and sends, activity imports, genomic imports, etc refresh refreshes from clients, pulse clients, and report list, show, bredsum, and other reports system logon, program starts and exits, and various system level messages task tasks run from the task scheduler utility chkfile filein, and other utility commands other these are unable to categorize and could occasionally occur in the initial creation of the activity log overtime there will be fewer of these search enhanced activity logs there are two edit boxes available for searching the logs use the cow id field to search activity logs for a specific animal, or use the full search field to find all other text or numeric data click the x in the search box to clear the search and display the default logs