AgSource KetoMonitor Widget Details
Graph
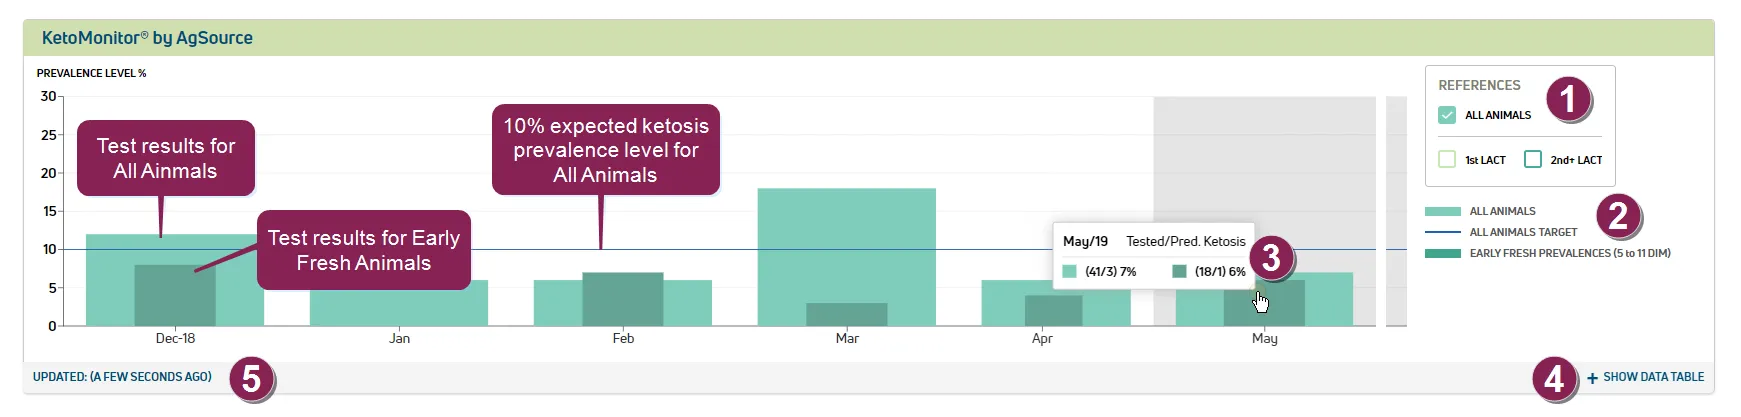
The graph displays ketosis test data for animals in early lactation, making a distinction between the early fresh period (5 - 11 DIM) and the general fresh period (5 - 20 DIM). The graph displays test results for the previous 6 months, and includes a target ketosis prevalence level line to quickly gauge whether the results are at or near expected levels.
Ketosis is predicted to occur in 5% of fresh animals in their 1st lactation and 15% of animals in later lactations, for an average of 10% for all fresh animals.
All Animals
1st/2nd Lactation
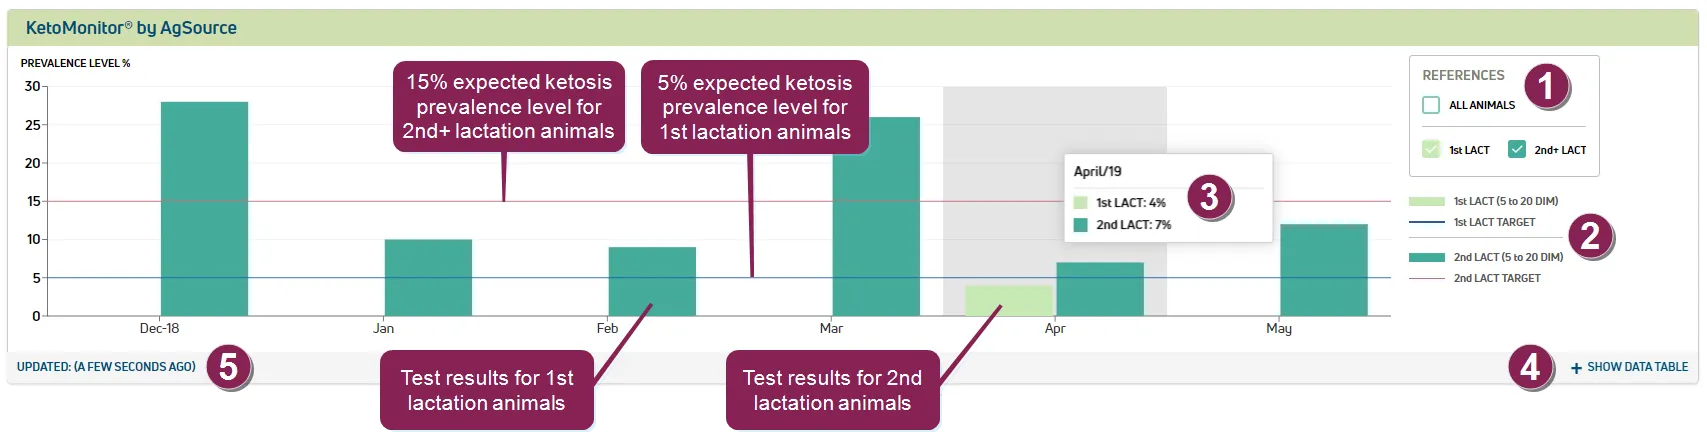
References: Select to view ketosis test data for All Animals, or by 1st/2nd+ Lactation.
Key: Identifies the data shown:
- When All Animals are selected, the graph displays data for all fresh animals (wide bar) and early fresh animals (narrow bar), as well as the 10% target line.
- When 1st and/or 2nd+ Lactation is selected, the graph displays data for the lactation(s), as well as the 5% (1st lactation) and/or 15% (2nd+ lactation) target lines.
Tooltip: Hover over the graph data to view data details for that month.
Show More Info: Select this option to view 12 months of data below the graph in a table format.
Updated: Timestamp (date and time) of the last data sync from AgSource.
More Info Table
The table area below the graph provides ketosis test data for the last 12 months.

Animals: Identifies the animals for which data is shown:
- All Animals: All fresh animals (5-20 DIM)
- Early Fresh (5-11 DIM): Animals 5-11 DIM
- 1st Lact: Animals in their first lactation
- 2nd+ Lact: Animals in their second (or later) lactation
Updated: Timestamp (date and time) of the last data sync from AgSource.
Ketosis Data: The Predicted Ketosis/Tested Animals data is presented in total number of animals and as a percentage.
Hide Info: Select this option to collapse the table.