Lactation Tab
1 min
The Lactation tab displays details on the animal's current lactation, including a graph of milk weights that can be compared against other test day data. The averages on this tab are adjusted curves, derived either from monthly test data loads in RECEIVE or through input of daily milk weights.
If the animal does not have a lactation on record, note that this tab is replaced with the Lifetime TabLifetime Tab.
Follow these guidelines when viewing the data on the Lactation tab:
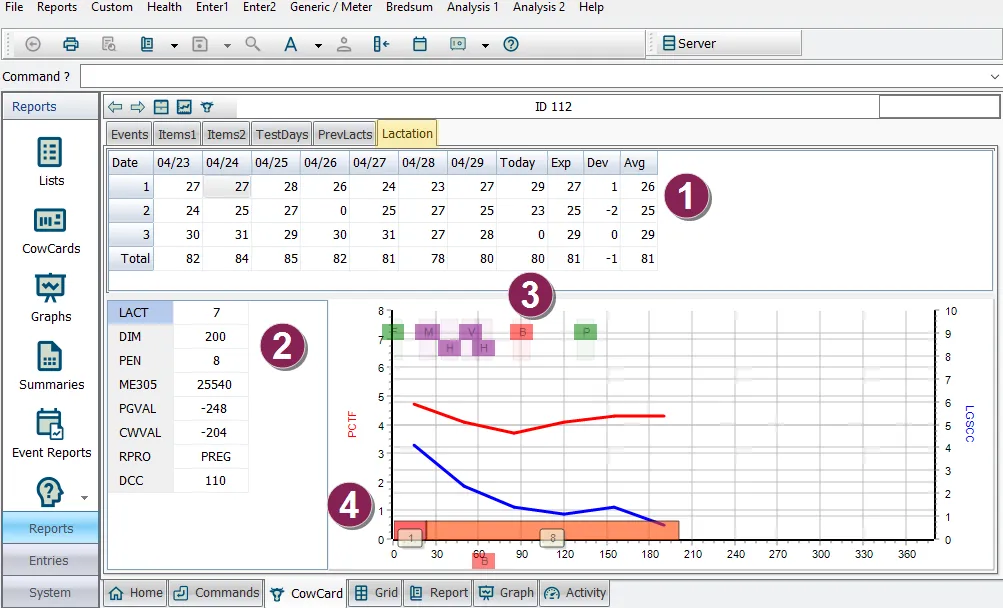
- Daily milk weights are displayed at the top of the tab: If the cowfile is configured for daily milk weights, the last 7 days of individual weights, totals, and averages are displayed above the graph at the top of the tab. You can double‑click on any of the daily weights to change them. However, for herds not using daily weights, be aware that this curve is recalculated each time test days are loaded with RECEIVE.
- Items Column: These items provide more information about the animal whose data is being graphed. As with other tabs, you can change any of these items at any time by right-clicking it.
- Event tags: Each marker at the top of the graph represents an event entered for the animal in DairyComp. If your herd uses our DairyComp protocols, the graph displays health events with yellow markers and all other events with purple markers. By hovering your cursor over a marker, you can see the event name, date, and what was typed in the Remark field when the event was created.
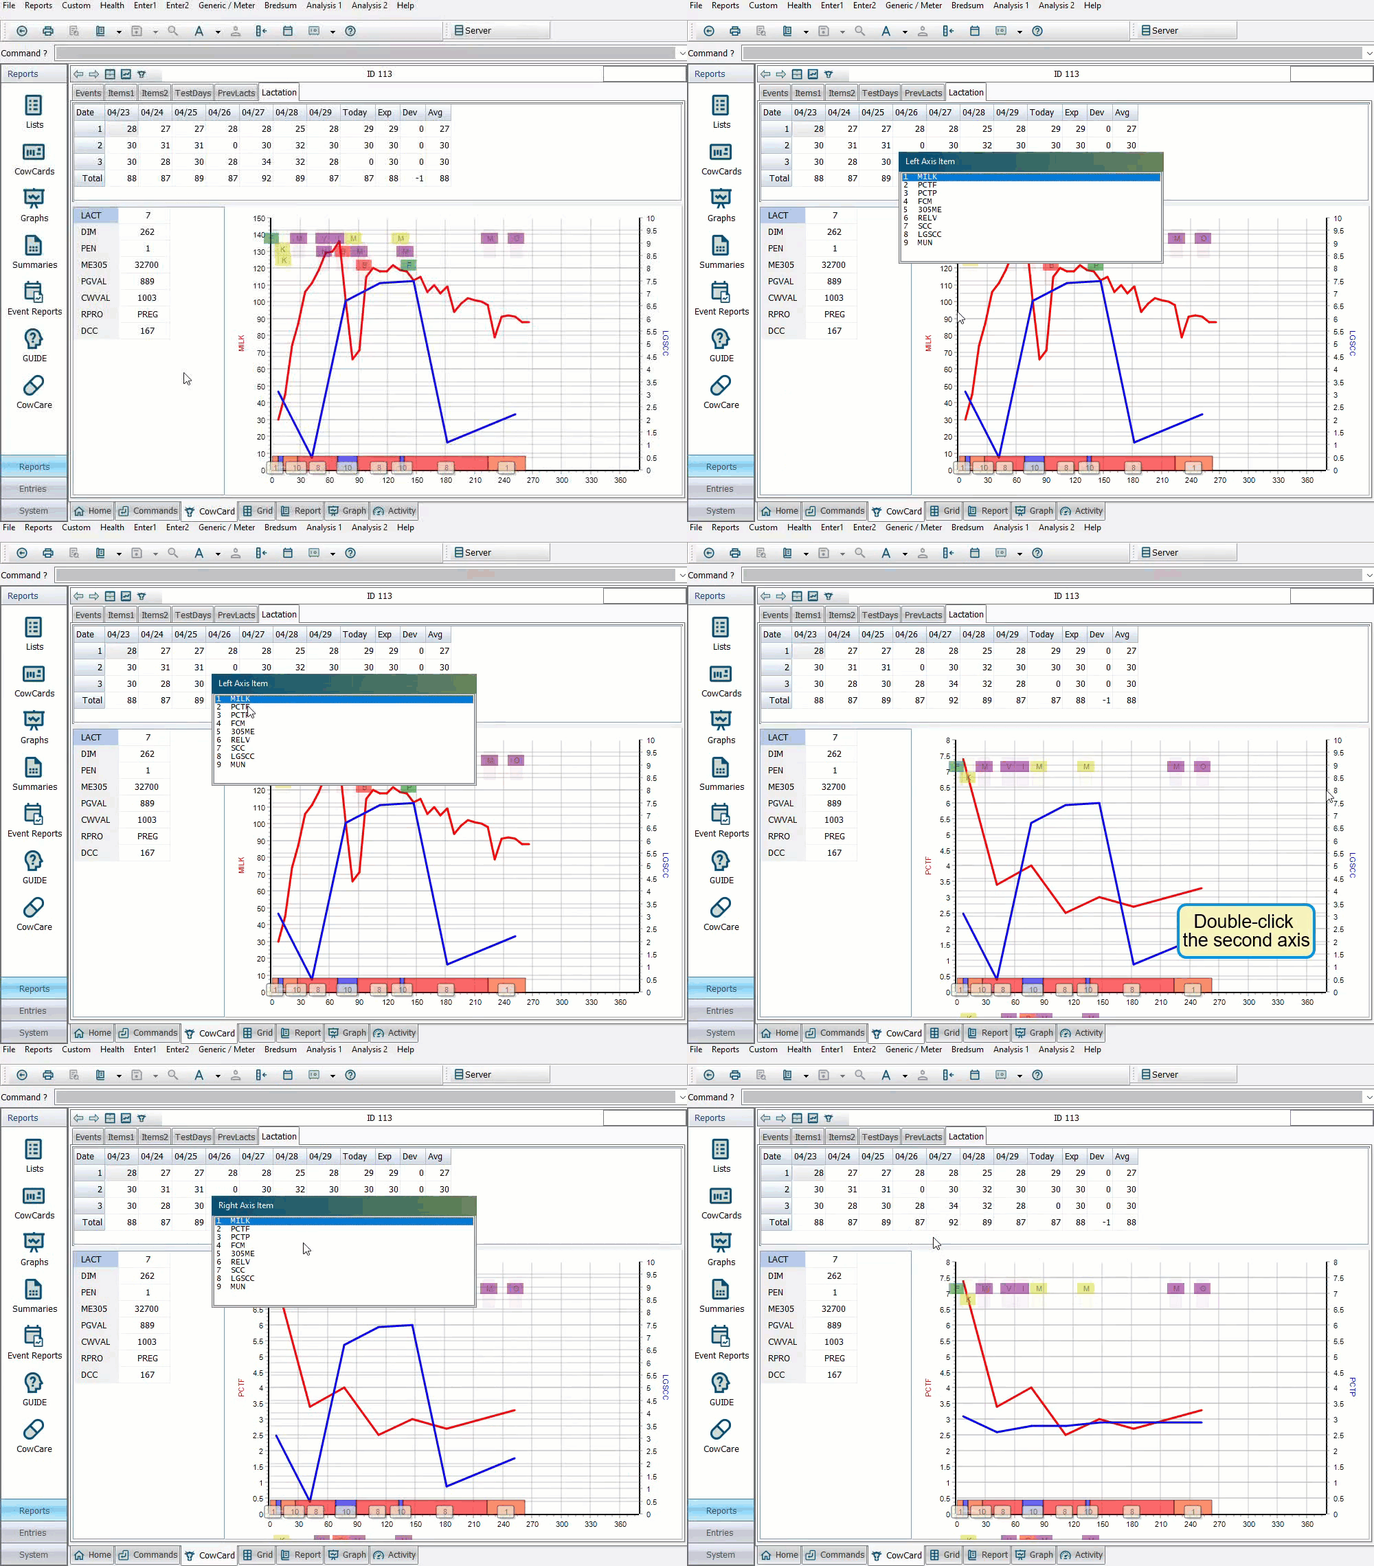
- Customize the graph display: You can customize the data used by both axes by clicking directly on the left or right axis and selecting a different test day item. The default is Milk on the left axis and Log SCC on the right. For example, you could change the right axis to display percent fat instead. You could also display fat on one axis, protein on the other, and look for inversions.